The dashboard screen is the first thing you'll see when you open SiteZeus. This is the heart of the application and the place where you can search for locations, build layers, analyze prospective sites, study traffic patterns, generate heat maps, run whitespace analyses, visualize trade areas, and manage territories.
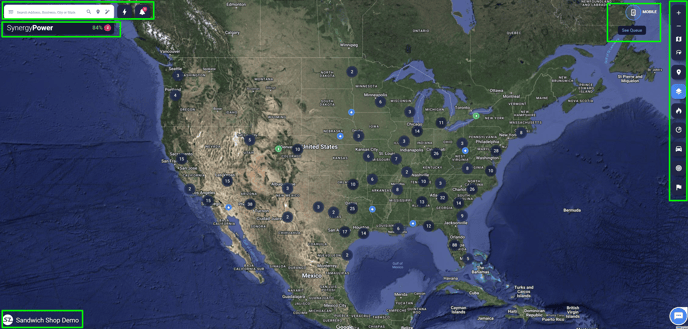
Search Bar
From the Search Bar, you can enter the main menu by clicking on the menu button (hamburger icon) on the left portion of the Search Bar.
You can also search in SiteZeus for locations, brands, and business categories. After typing your search criteria into the search bar, you may run three types of searches:
- Magnifying glass search: Selecting the magnifying glass icon will return up to 20 results around the area you're viewing on the map.
- Layer Database search: Selecting the Layer Database will open the point-of-interest (POI) database. You can search by category, sub-category, or brand name to quickly add all U.S. locations to the layer of your choice.
- Magic wand search: The Magic Wand will search within 10 miles of each Existing Site for the search criteria and return 20 results per location.
Synergy Power Gauge
The Synergy Power Gauge is where you will find all of the information about your predictive model. It's shown in its collapsed state in the screenshot above but can be expanded with a click. Use it to learn more about your model's accuracy, Variable Usage, Quadrant Recommendations, and Predictive Outliers.
Note: This panel is available to users with the Administrator, Co Administrator, Model Analyst, and Analyst roles.
Project Name
The name in the lower left-hand corner of the map is there to notify you which project you are currently in, which is especially helpful if you have multiple projects in your account.
Mobile Data
The mobile data button allows you to control the visualization and redemption of mobile data, which includes the path to purchase mobile data and once visualized can be filtered to certain times of day and days of week.
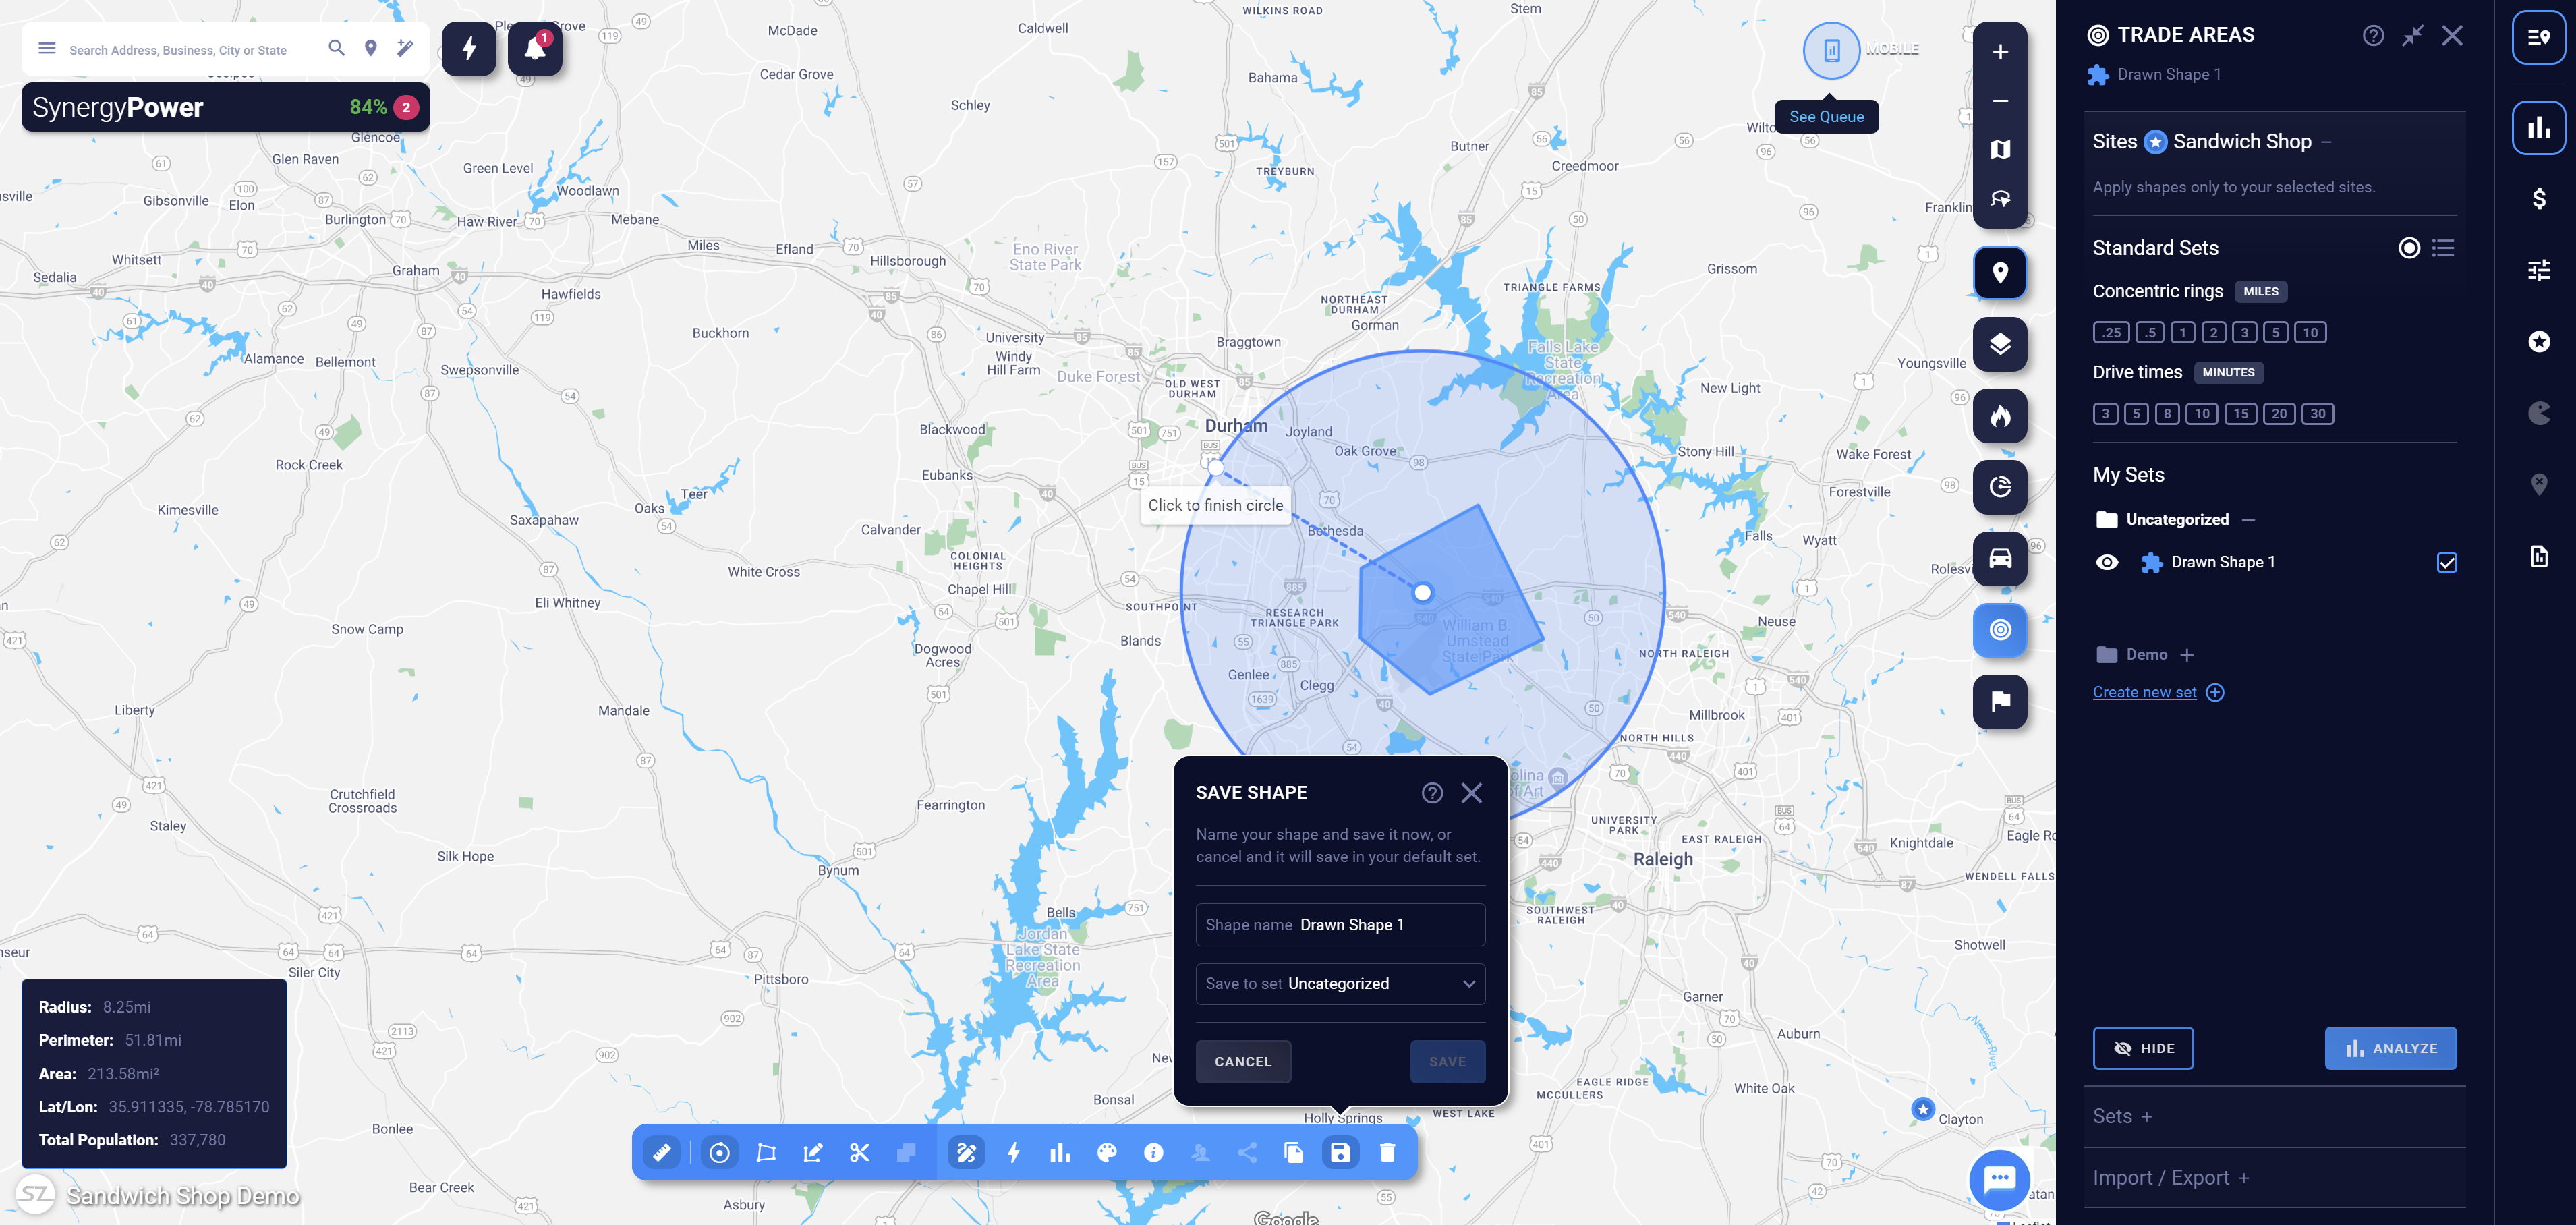
Trade Areas
Concentric Rings
Concentric rings allow you to visualize the reach of your business in the community given standard radius based rings. SiteZeus allows you to view several standard-sized concentric rings to mix and match the ring sizes that work best for you. These options include ¼ mile, ½ mile, and 1, 2, 3, 5, and 10 miles.
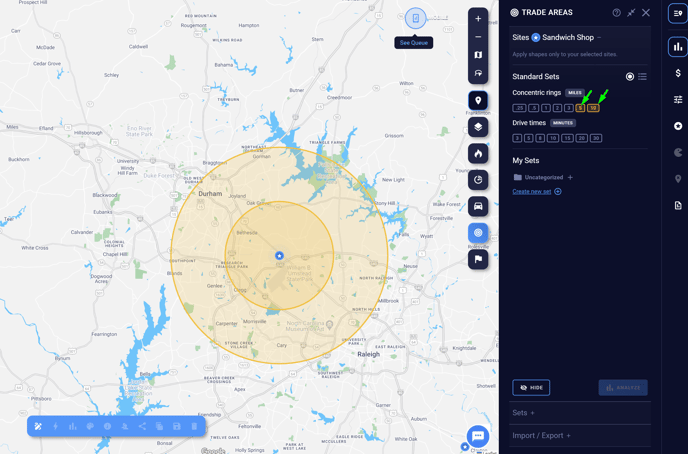
- Select a site by clicking on the pin or select a group of sites using the multi-select feature.
- Select on Trade Areas from within the Map Toolbar
- Click on the ring size you'd like to view
- You will see the ring or rings appear around your selected sites.
- Click on a mile size again to turn it off.
Drive Times
Drive times allow you to visualize the reach of your business in the community based on a standard minute based travel time. SiteZeus allows you to view several drive times to mix and match the drive times that work best for a market. These options include 3, 5, 8, 10, 15, 20, and 30 minutes.
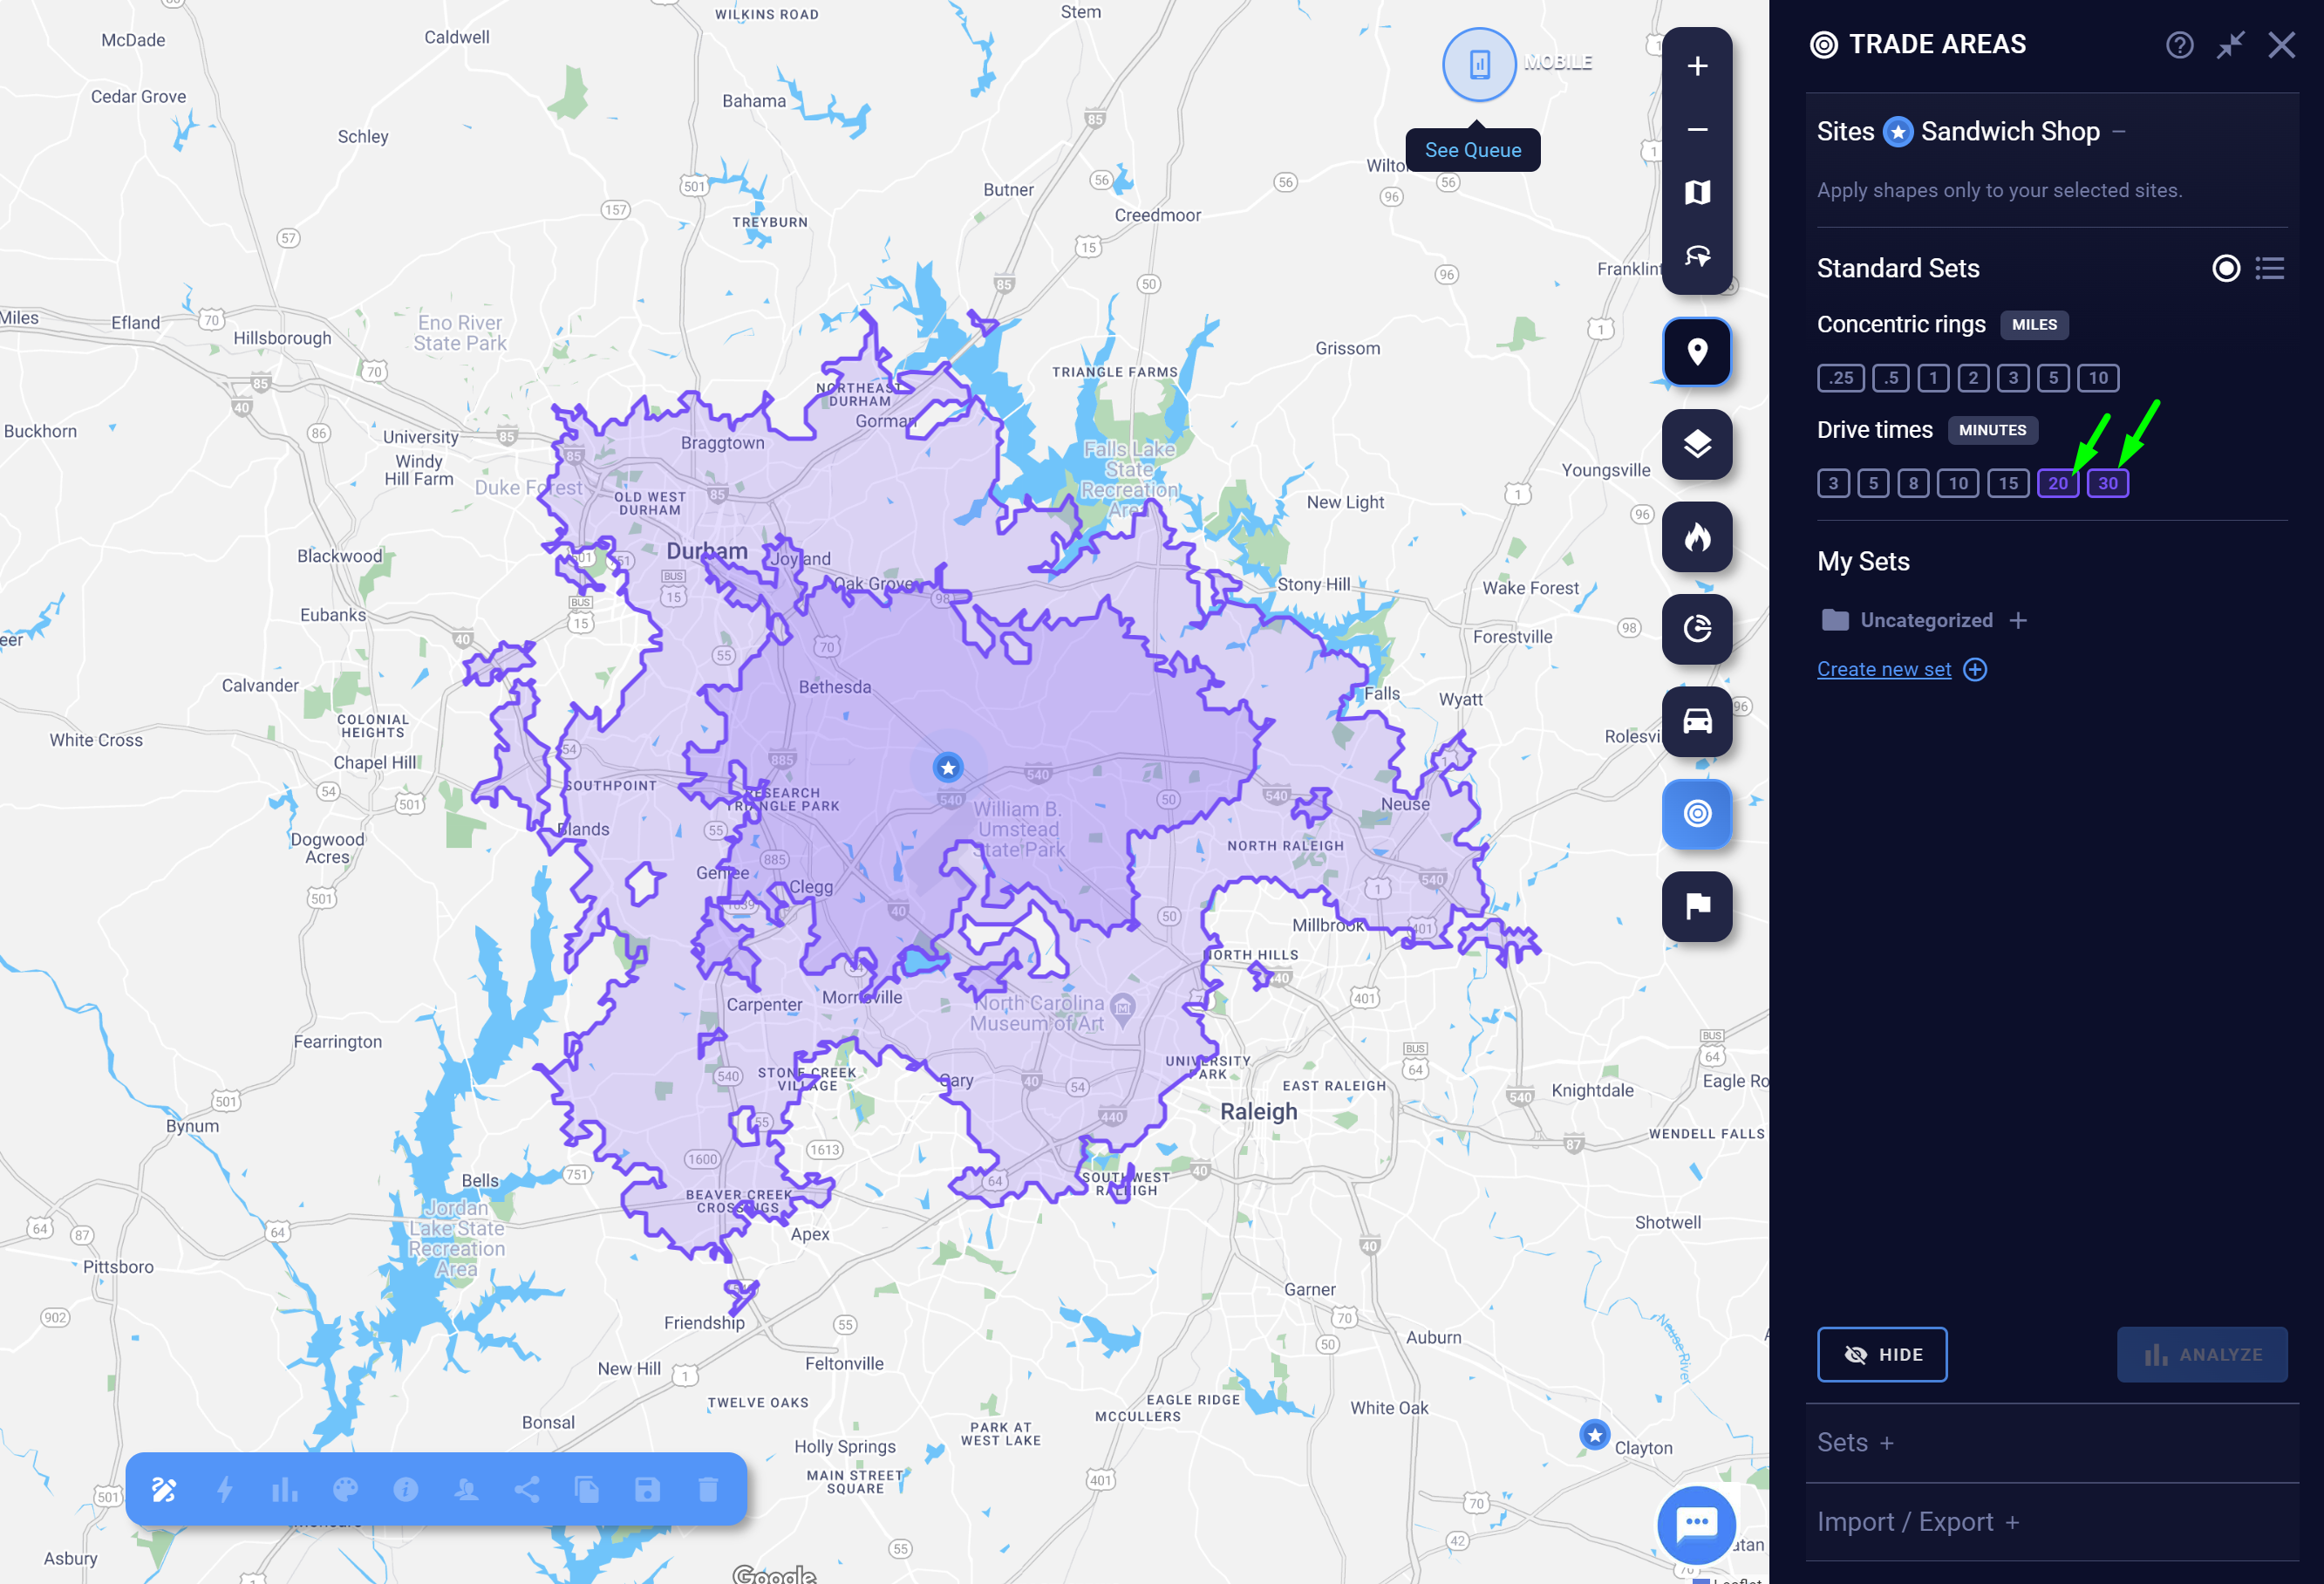
- Select a site by clicking on the pin or select a group of sites using the multi-select feature.
- Select on Trade Areas from within the Map Toolbar
- Click on the drive time you'd like to view
- You will see the drive time shape or shapes appear around your selected sites
- Click on a minute time again to turn it off.
Custom Shapes
Note: This capability is only available to customers who are subscribed to Territory Management. If you are interested in learning more about the add on, please contact your support analyst.
- Select a site by clicking on the pin or select a group of sites using the multi-select feature
- Select on Trade Areas from within the Map Toolbar
- Click on the Draw A Polygon or Draw A Circle options
- Turn on the Measure Tool if you would like to assess the size of your shape as you draw
- Start to draw your shape on the map
- Save, make edits, color, share your shape and more!
Map Toolbar
The Map Toolbar on the right side of the screen contains most of the mapping tools in the platform.
- Zoom in: Increase the zoom level of the map.
- Zoom out: Decrease the zoom level of the map.
- Map view mode: Change between satellite view (default), dark mode, and light mode.
- Lasso: Draw a shape to select multiple sites at once.
- Sites: Manage all the sites in your project
- Layers: Layers lets you toggle on/off site types in your project. Also toggle revenues, territories, and POIs.
- Heat map: Create heat maps to visualize revenue potential or demographic data.
- Site Sonar: Use our white space analysis solution, Site Sonar, to optimize markets and project revenues for sites nationwide.
- Traffic: The traffic tool allows you to access traffic counts. After you click the Traffic button, all roads with available data will be highlighted.
- Average daily volume: Hover over each segment to see the average daily volume and direction.
- Day-part information: INRIX subscribers can click a road segment to access enhanced traffic data broken down by the time of day and day of week.
- Trade areas: Trade Areas allows you to visualize polygons based on concentric rings, drive times, mobile data, or custom sets. Contact the SiteZeus support team if you'd like to add the ability to visualize custom sets.
- Territories: Territories allows you to visualize and analyze both standard and custom geographies. Contact the SiteZeus support team if you'd like to add this feature.