What is traffic data?
SiteZeus partners with INRIX for traffic data, which is refreshed annually.SiteZeus provides two levels of traffic detail:
- Annual Average Daily Traffic Counts (AADT) — included with all subscriptions
- Day-parted and day-of-week traffic counts— included with a data bundle subscription
Traffic data is automatically pulled into your model. For each site, SiteZeus looks for the two nearest named roads with traffic data, then averages the total traffic for each road for inclusion in the model. If you have an INRIX subscription, day-parted traffic will also be included in your model.
Annual Average Daily Traffic (AADT)
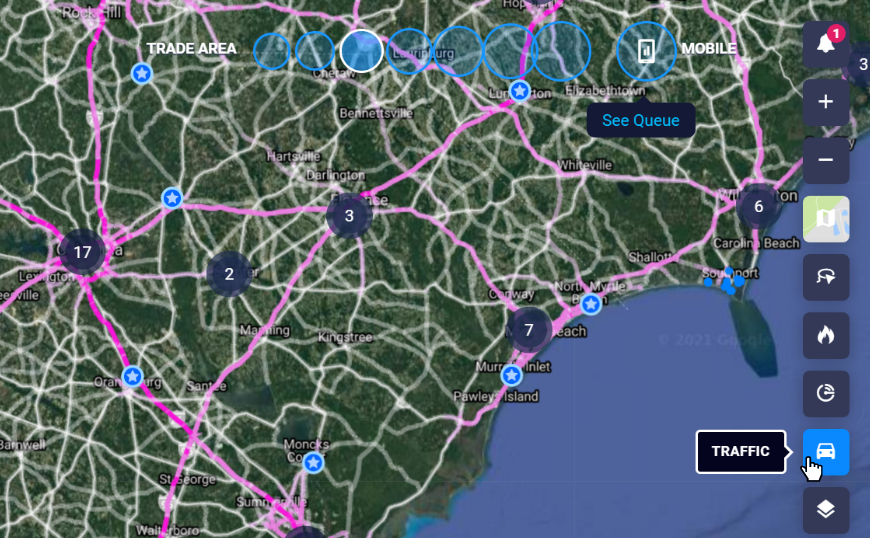
Use the traffic button in the Map Toolbar to turn traffic visualization on or off.
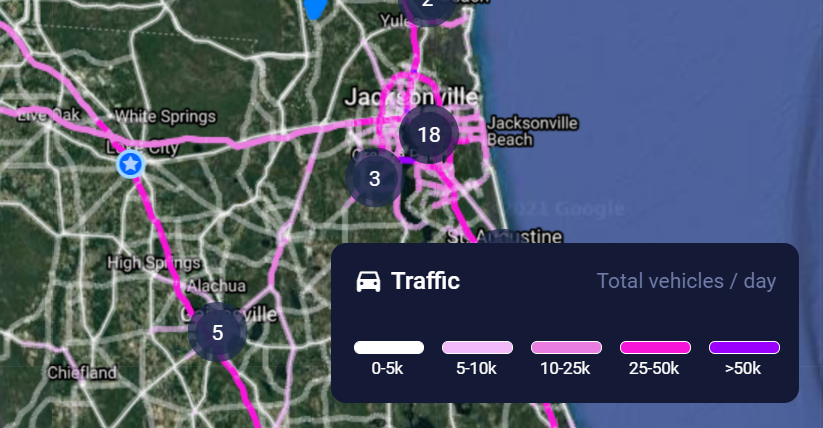
The road segments are color coded by traffic count, as shown in the legend in the bottom-right corner. The traffic legend is static and will not change based on the map's zoom level.
- Place the cursor over a segment to see itsAADT count and road segment direction.
- Move the cursor slightly to catch the traffic going in the other direction on that segment.
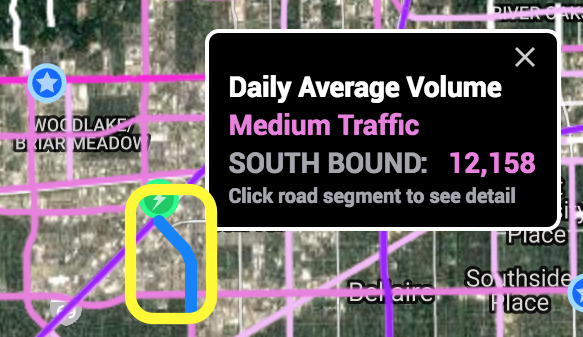
Note: To select a specific side of the road, you may need to zoom in until both sides appear when hovering over a road segment.
Day-parted and day-of-week traffic
Have you ever wondered what time of day sees the most traffic? Or what side of the road is busiest for breakfast? Are you tired of sitting in parking lots at 5 a.m. counting cars and sipping coffee? These are all great reasons to subscribe to the INRIX day-parted and day-of-week traffic.
Accessing day-parted and day of week traffic
- Turn traffic data on.
- Click a road segment to open the traffic panel.
- The top portion of the window displays the total traffic volume and identifies the segment that you've selected.
- The grid below breaks down traffic by time, day, weekend, and weekday.
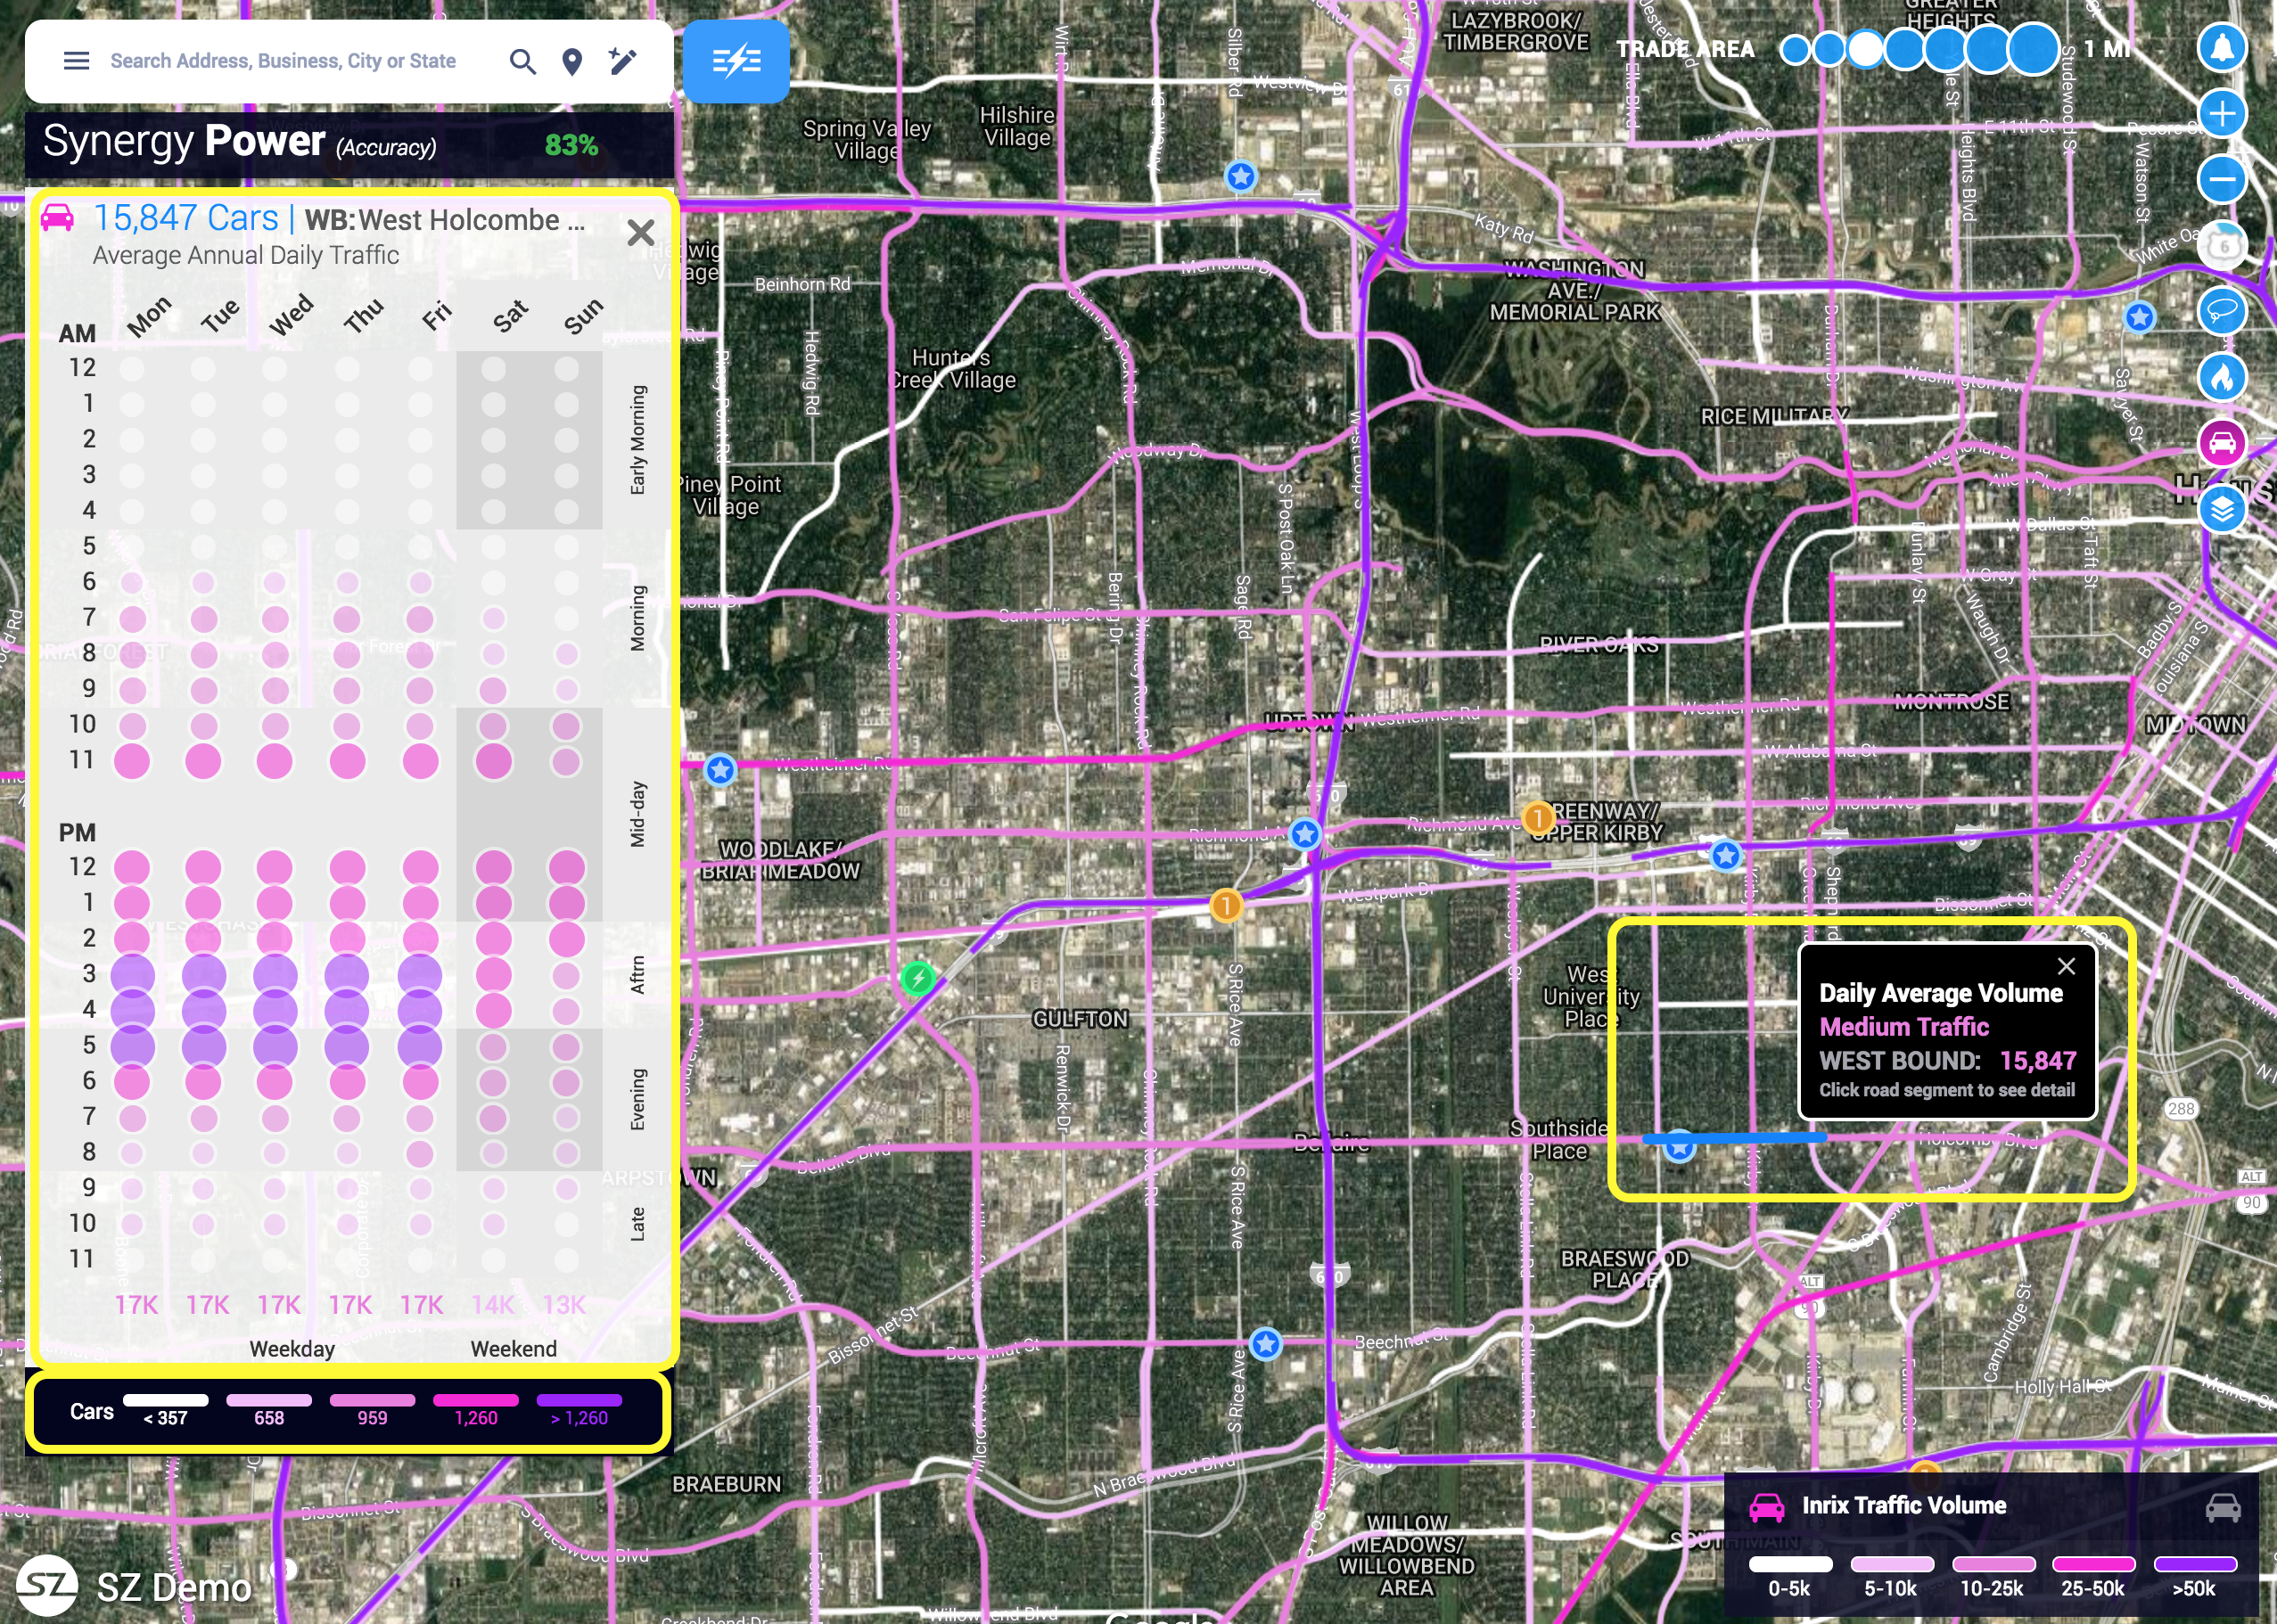
By default, this information is displayed as bubbles, the size and color of which indicate the relative traffic volume. However, you may change the bubbles to numbers by hovering over any of the headings in the table.
The legend in the bottom-right corner of the window indicates the range of traffic in each bubble color.