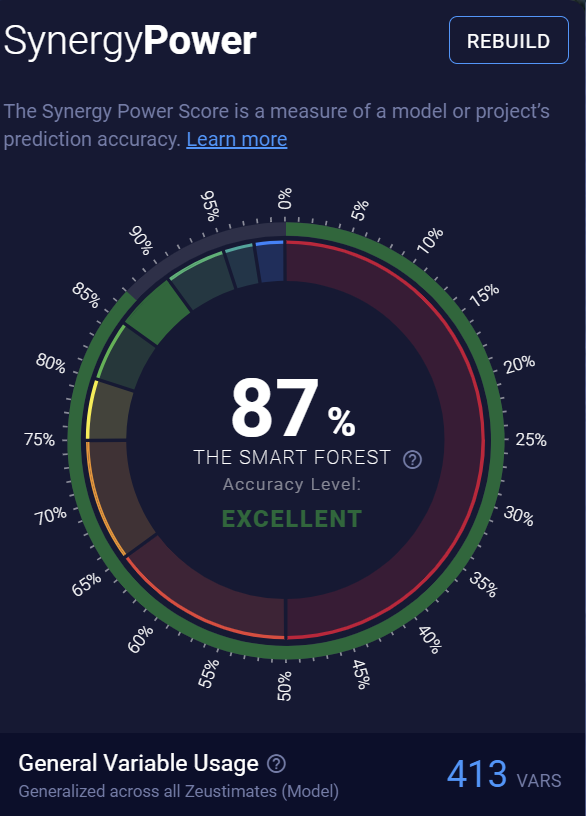
The Synergy Power Score is a calculation that describes the model's accuracy as determined by back testing the model to predict the results of existing stores. When computing this score, we measure how well the model performs when making predictions for data it's never seen before, providing a fairer measure of accuracy.
- Synergy Score overview
- General Variable Usage
- Quadrant Recommendations
- Predictive Outliers
- How the Synergy Score is calculated
- Rebuilding your model
Synergy Score overview
How the Synergy Score is calculated
Each project has a unique predictive model trained on your existing locations' physical makeup, operations metrics, revenues, nearby competitor sites, demographic data, traffic averages, and other information from the supplemental data sets you’ve subscribed to.
Our machine learning processes use your model’s data to predict performance at every existing store. We compare those results to actual sales, and the deviation is how we score your model's degree of accuracy. This confidence factor is also known as your Synergy Power Score.
Cross-validation
We use an out-of-sample testing process called cross-validation to test statistical models for accuracy and predictive power. This involves iteratively building models using a subset of your sites while “withholding” a test site to test accuracy.
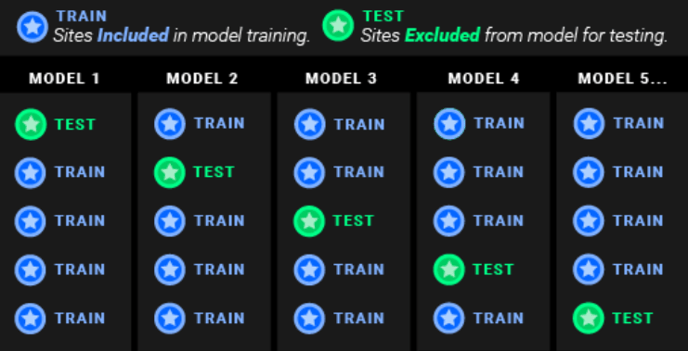
Our unique machine learning algorithms are based on hundreds of decision trees. Each tree is built using a random subset of your existing stores to "learn" from. We look at each of your existing stores and predict its revenues using only the subset of decision trees that didn't have an opportunity to "learn" about that store. We then subtract the store's actual revenues from the prediction to determine the margin of prediction error for that site.
The Synergy Power Score is based on the median of these errors as a percentage of the average unit volume (AUV) of the stores in the project. We subtract this percentage from 100 for the final Power Score.
- Example: If the median prediction error is $10,000 and your average store revenue is $100,000, the median prediction error is 10 percent of the AUV, giving a Power Score of 90% (100% - 10%). This means that about half the time, the model's margin of error for predictions is ± 10% of the AUV.
General Variable Usage
SiteZeus' advanced machine learning algorithm may not use variables in the same way from one projection to the next. The platform shows which variables are used across all possible projections and the frequency of their use as a relative percentage.
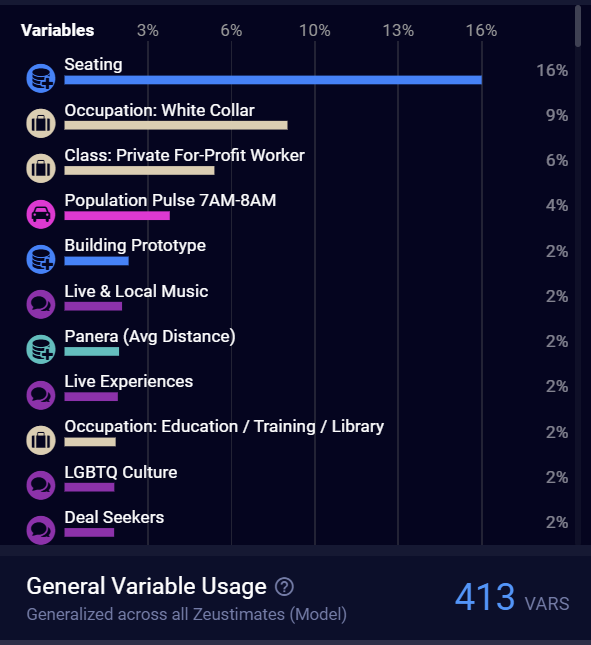
Caution: Don't mistake a low Variable Importance percentage for a low impact. Occasionally, rarely used variables can play a large role in your projections.
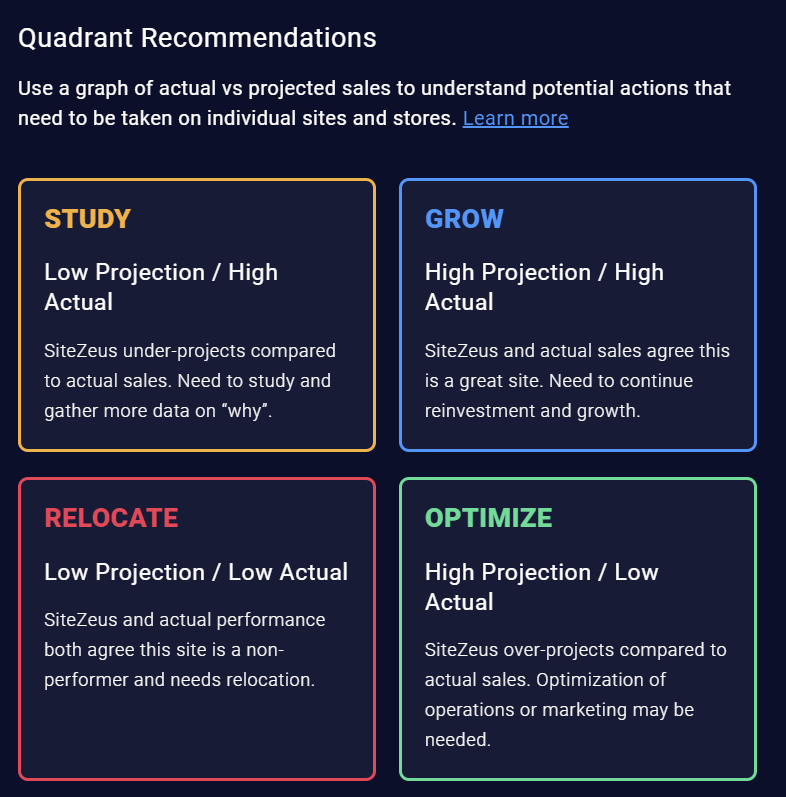
Quadrant Recommendations
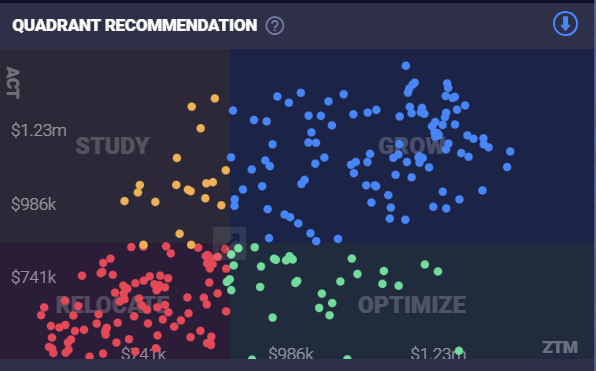
This portfolio optimization tool plots the difference between an existing site's actual and projected sales to determine whether there's opportunity to optimize the store.
Study: The model predicted revenues to be lower than they actually are. You should study these sites to see which additional data points could be added to the model to increase its predictive power.
Optimize: The model predicted revenues to be higher than they actually are. You should study these sites to see how their physical makeup or operations could be improved for optimal performance.
Grow: The model predicted revenues to be high, and the actual revenues are high as well.
Relocate: The model predicted revenues to be low, and the actual revenues are low as well. You should consider relocating these sites to increase your AUV and per-market revenue.
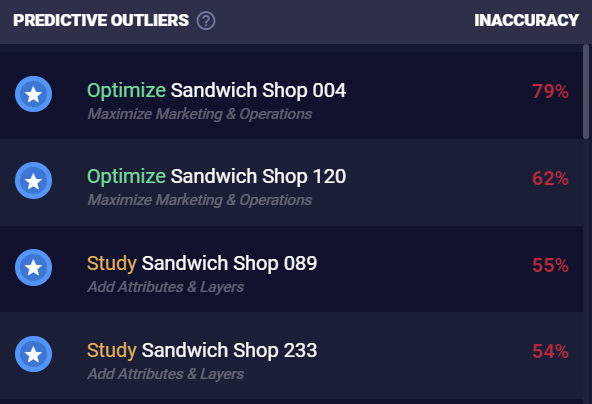
Predictive Outliers
Using the individual error results visualized in the Quadrant Recommendations above, we then list the 10 percent of sites in your model that are the least predictable. This offers insight into what data might be missing from your model so you can add attributes and layers to enhance your Synergy Power Score.
Rebuilding your model
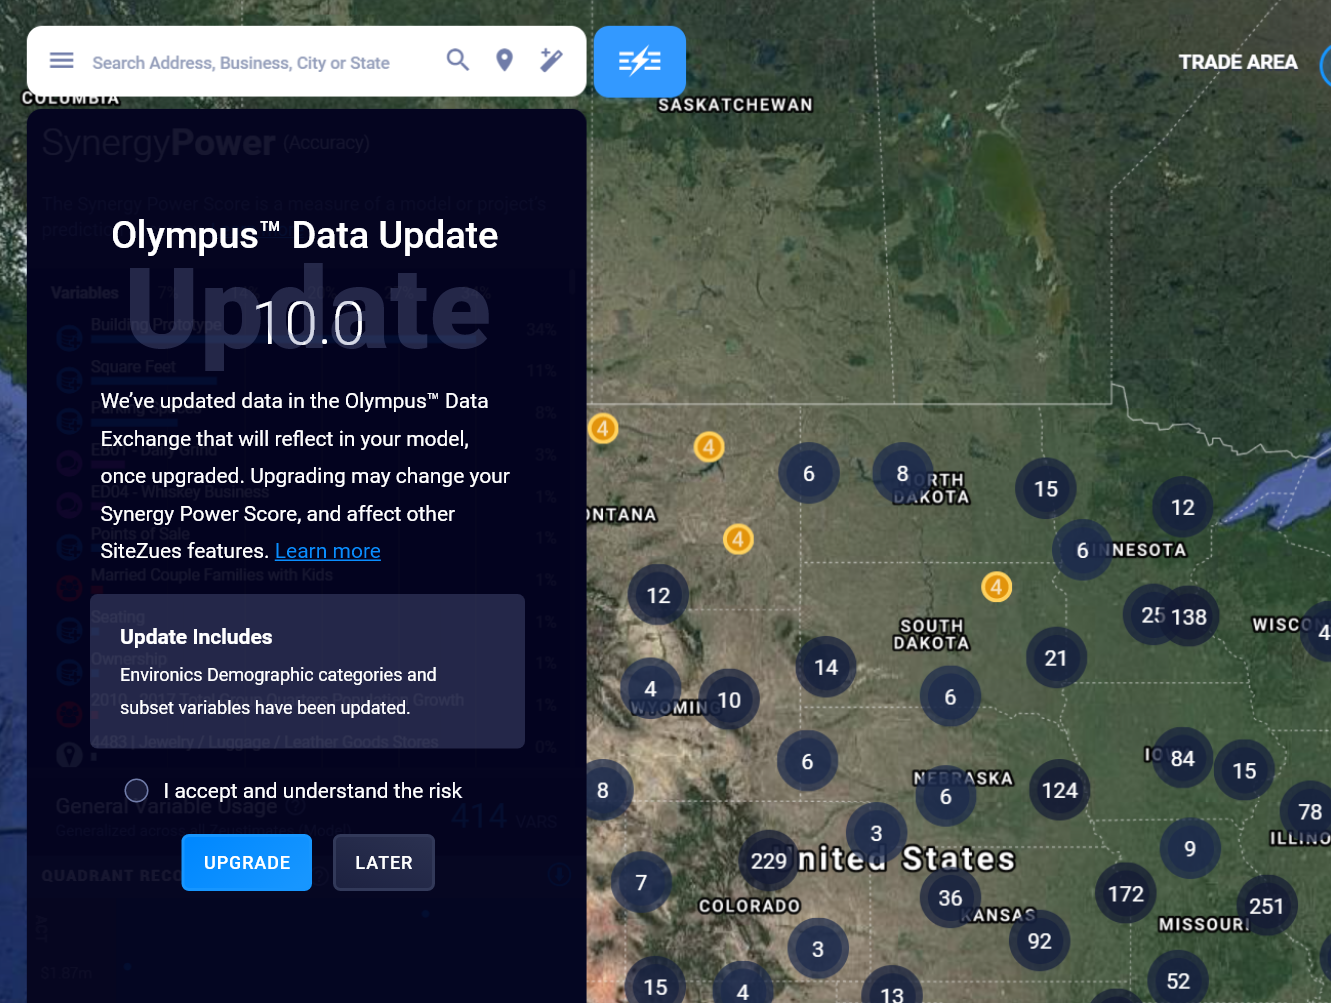
When data or our platform gets updated, your model will need to be rebuilt, and this will result in a new Synergy Power Score. Updates to any of the following will prompt you to rebuild your model:
Our data: We use data bundles such as INRIX traffic data and Near mobile location data. There are hundreds of data points in each data bundle that are factored into our calculations.
Your data: Site revenues, site attributes/characteristics, and layers (data on competitor or synergistic brands)
SiteZeus platform upgrades
We continuously refine our machine learning software and processes for the highest quality results. Since the Synergy Power Score is a culmination of the sales projections for all individual sites, any SiteZeus features involving projections will be affected when a model is rebuilt.
- Individual Zeustimates
- Site Sonar results
- Revenue heat map results
- Saved reports: Zeustimates in saved reports will remain the same until the model is rebuilt. If you decline to rebuild your model, your model projections may not match those in older saved report.
When will I be prompted to rebuild my model?
If your data changes, a red bubble will appear in your Synergy Panel showing the number of new changes and requesting that you rebuild your model.
If our data changes or there's a platform upgrade, you'll see a notice as an overlay on the Synergy Panel.