What is a Zeustimate?
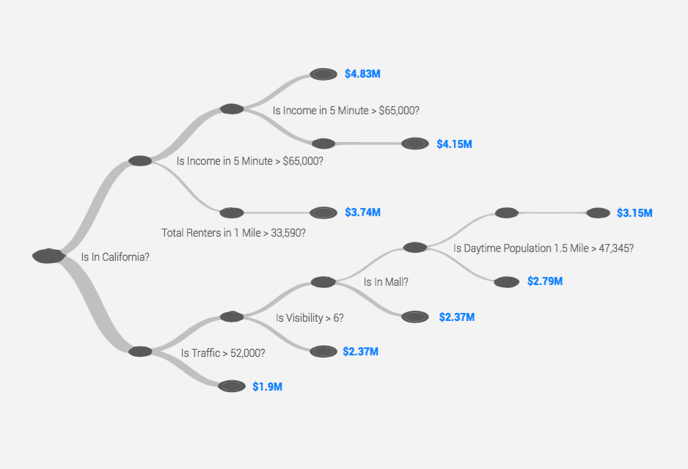
A Zeustimate is a projection on a location that is calculated based on the data that is influencing your model. A Zeustimate is created after the location's information is processed though a random forest algorithm.
How to generate a Zeustimate
- On the map, click on a pin or drop a new pin to see the Zeustimate display in the active panel to the right.
- Adjust and test the changes for your site attribute
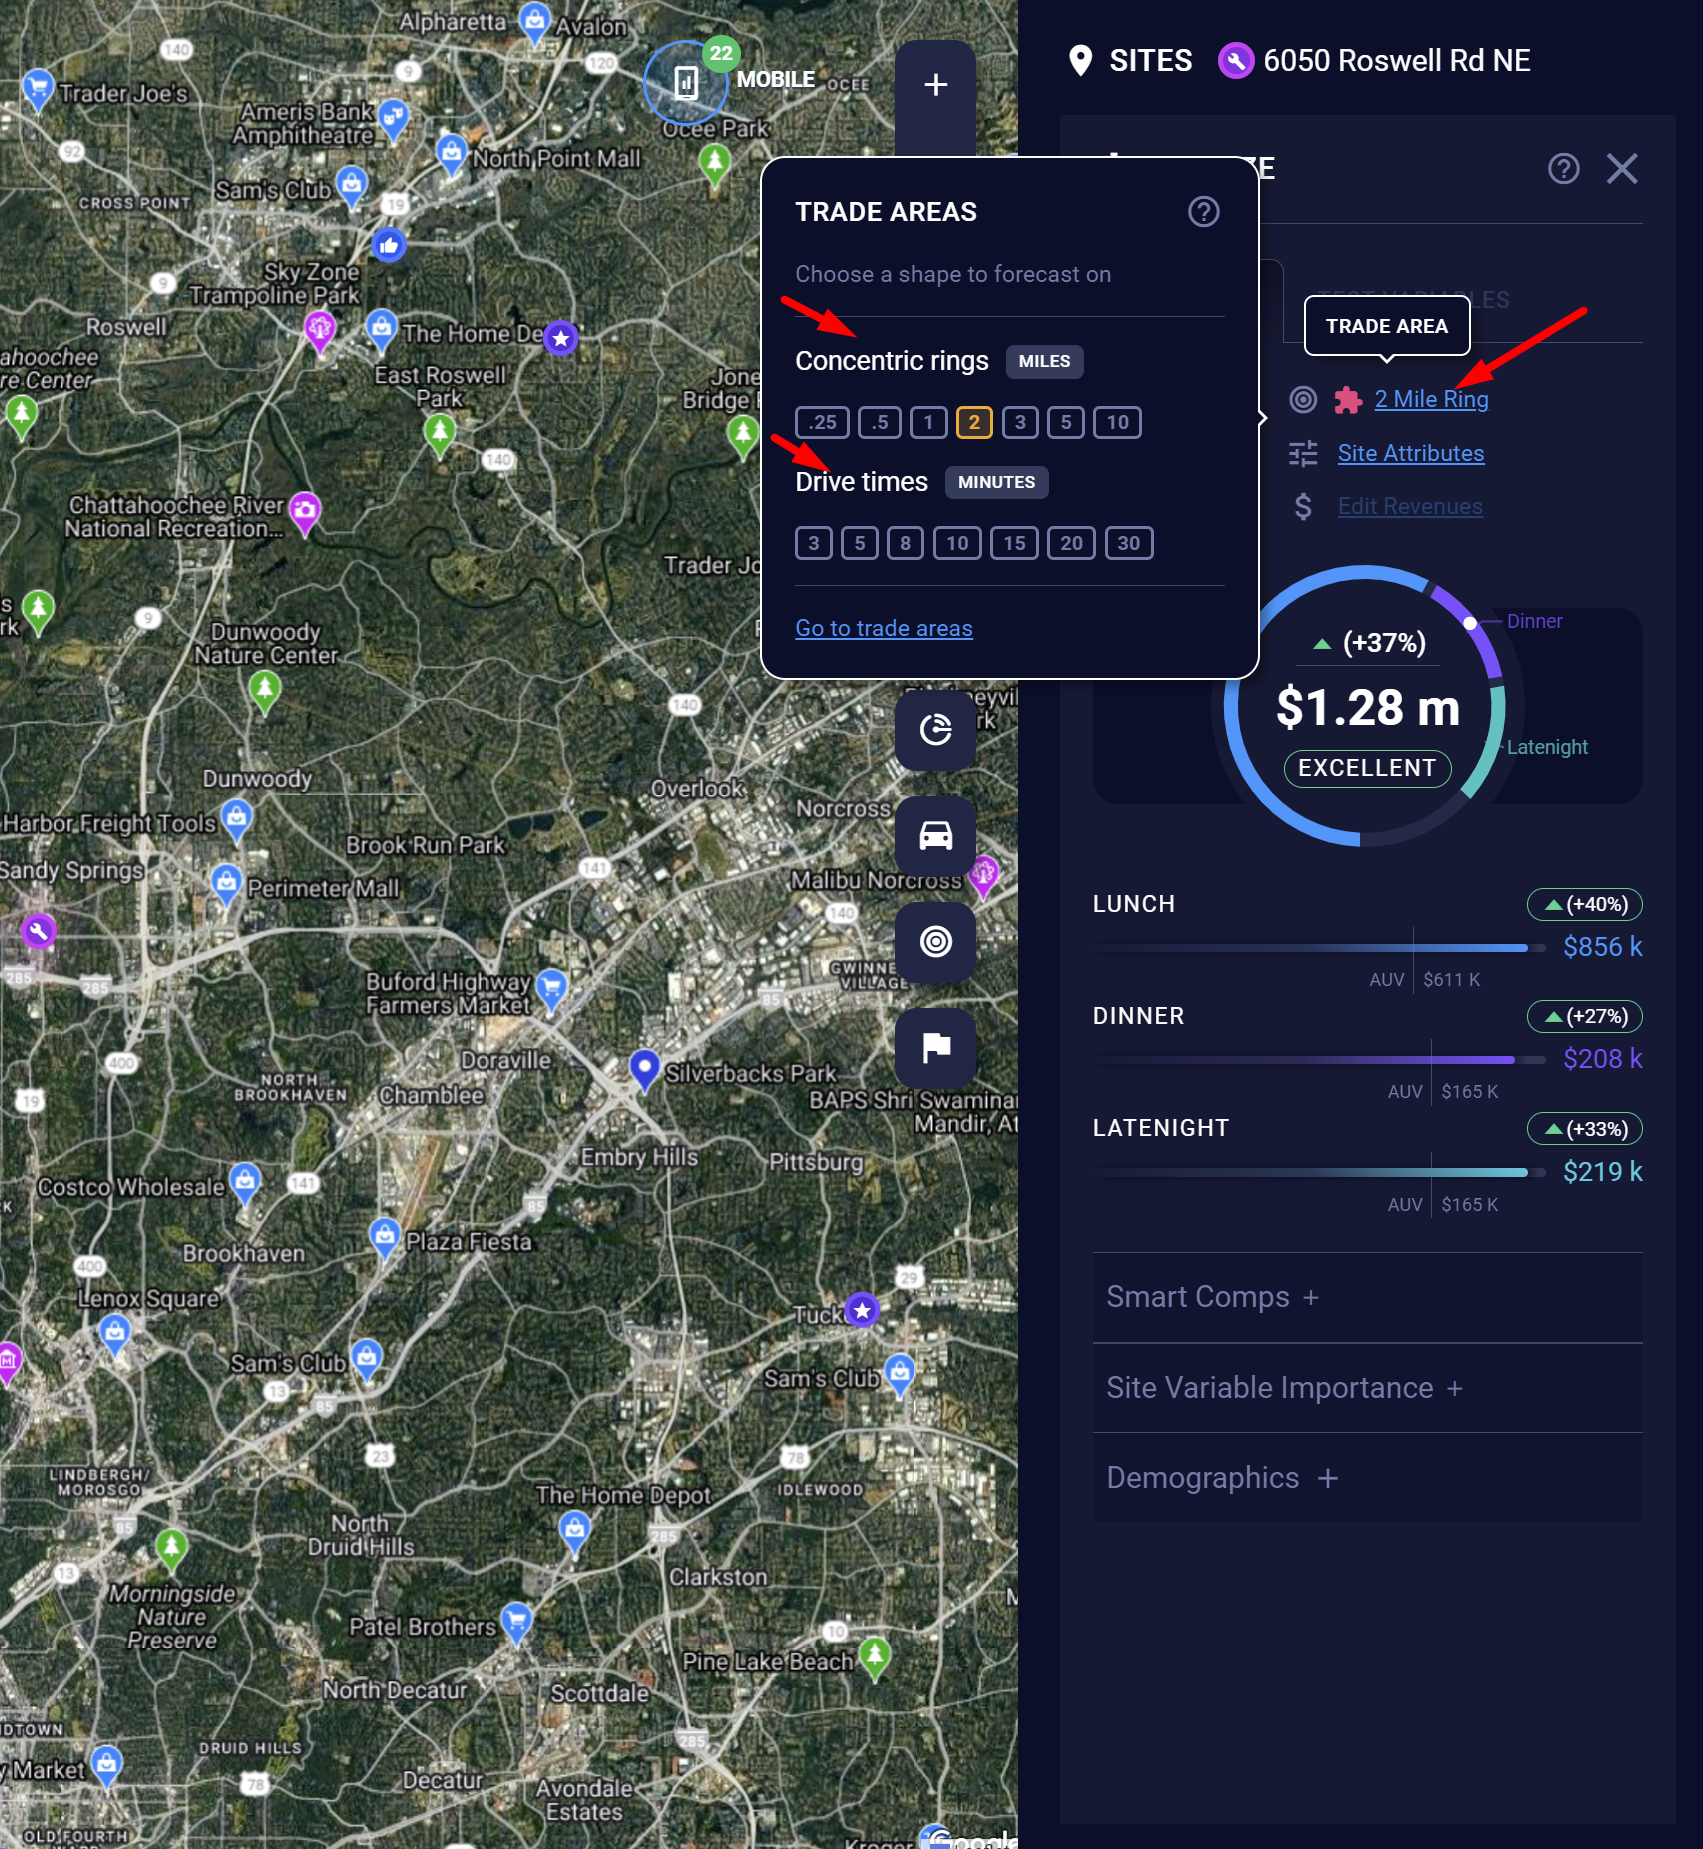
- Select your desired forecasting trade area or drive time trade area
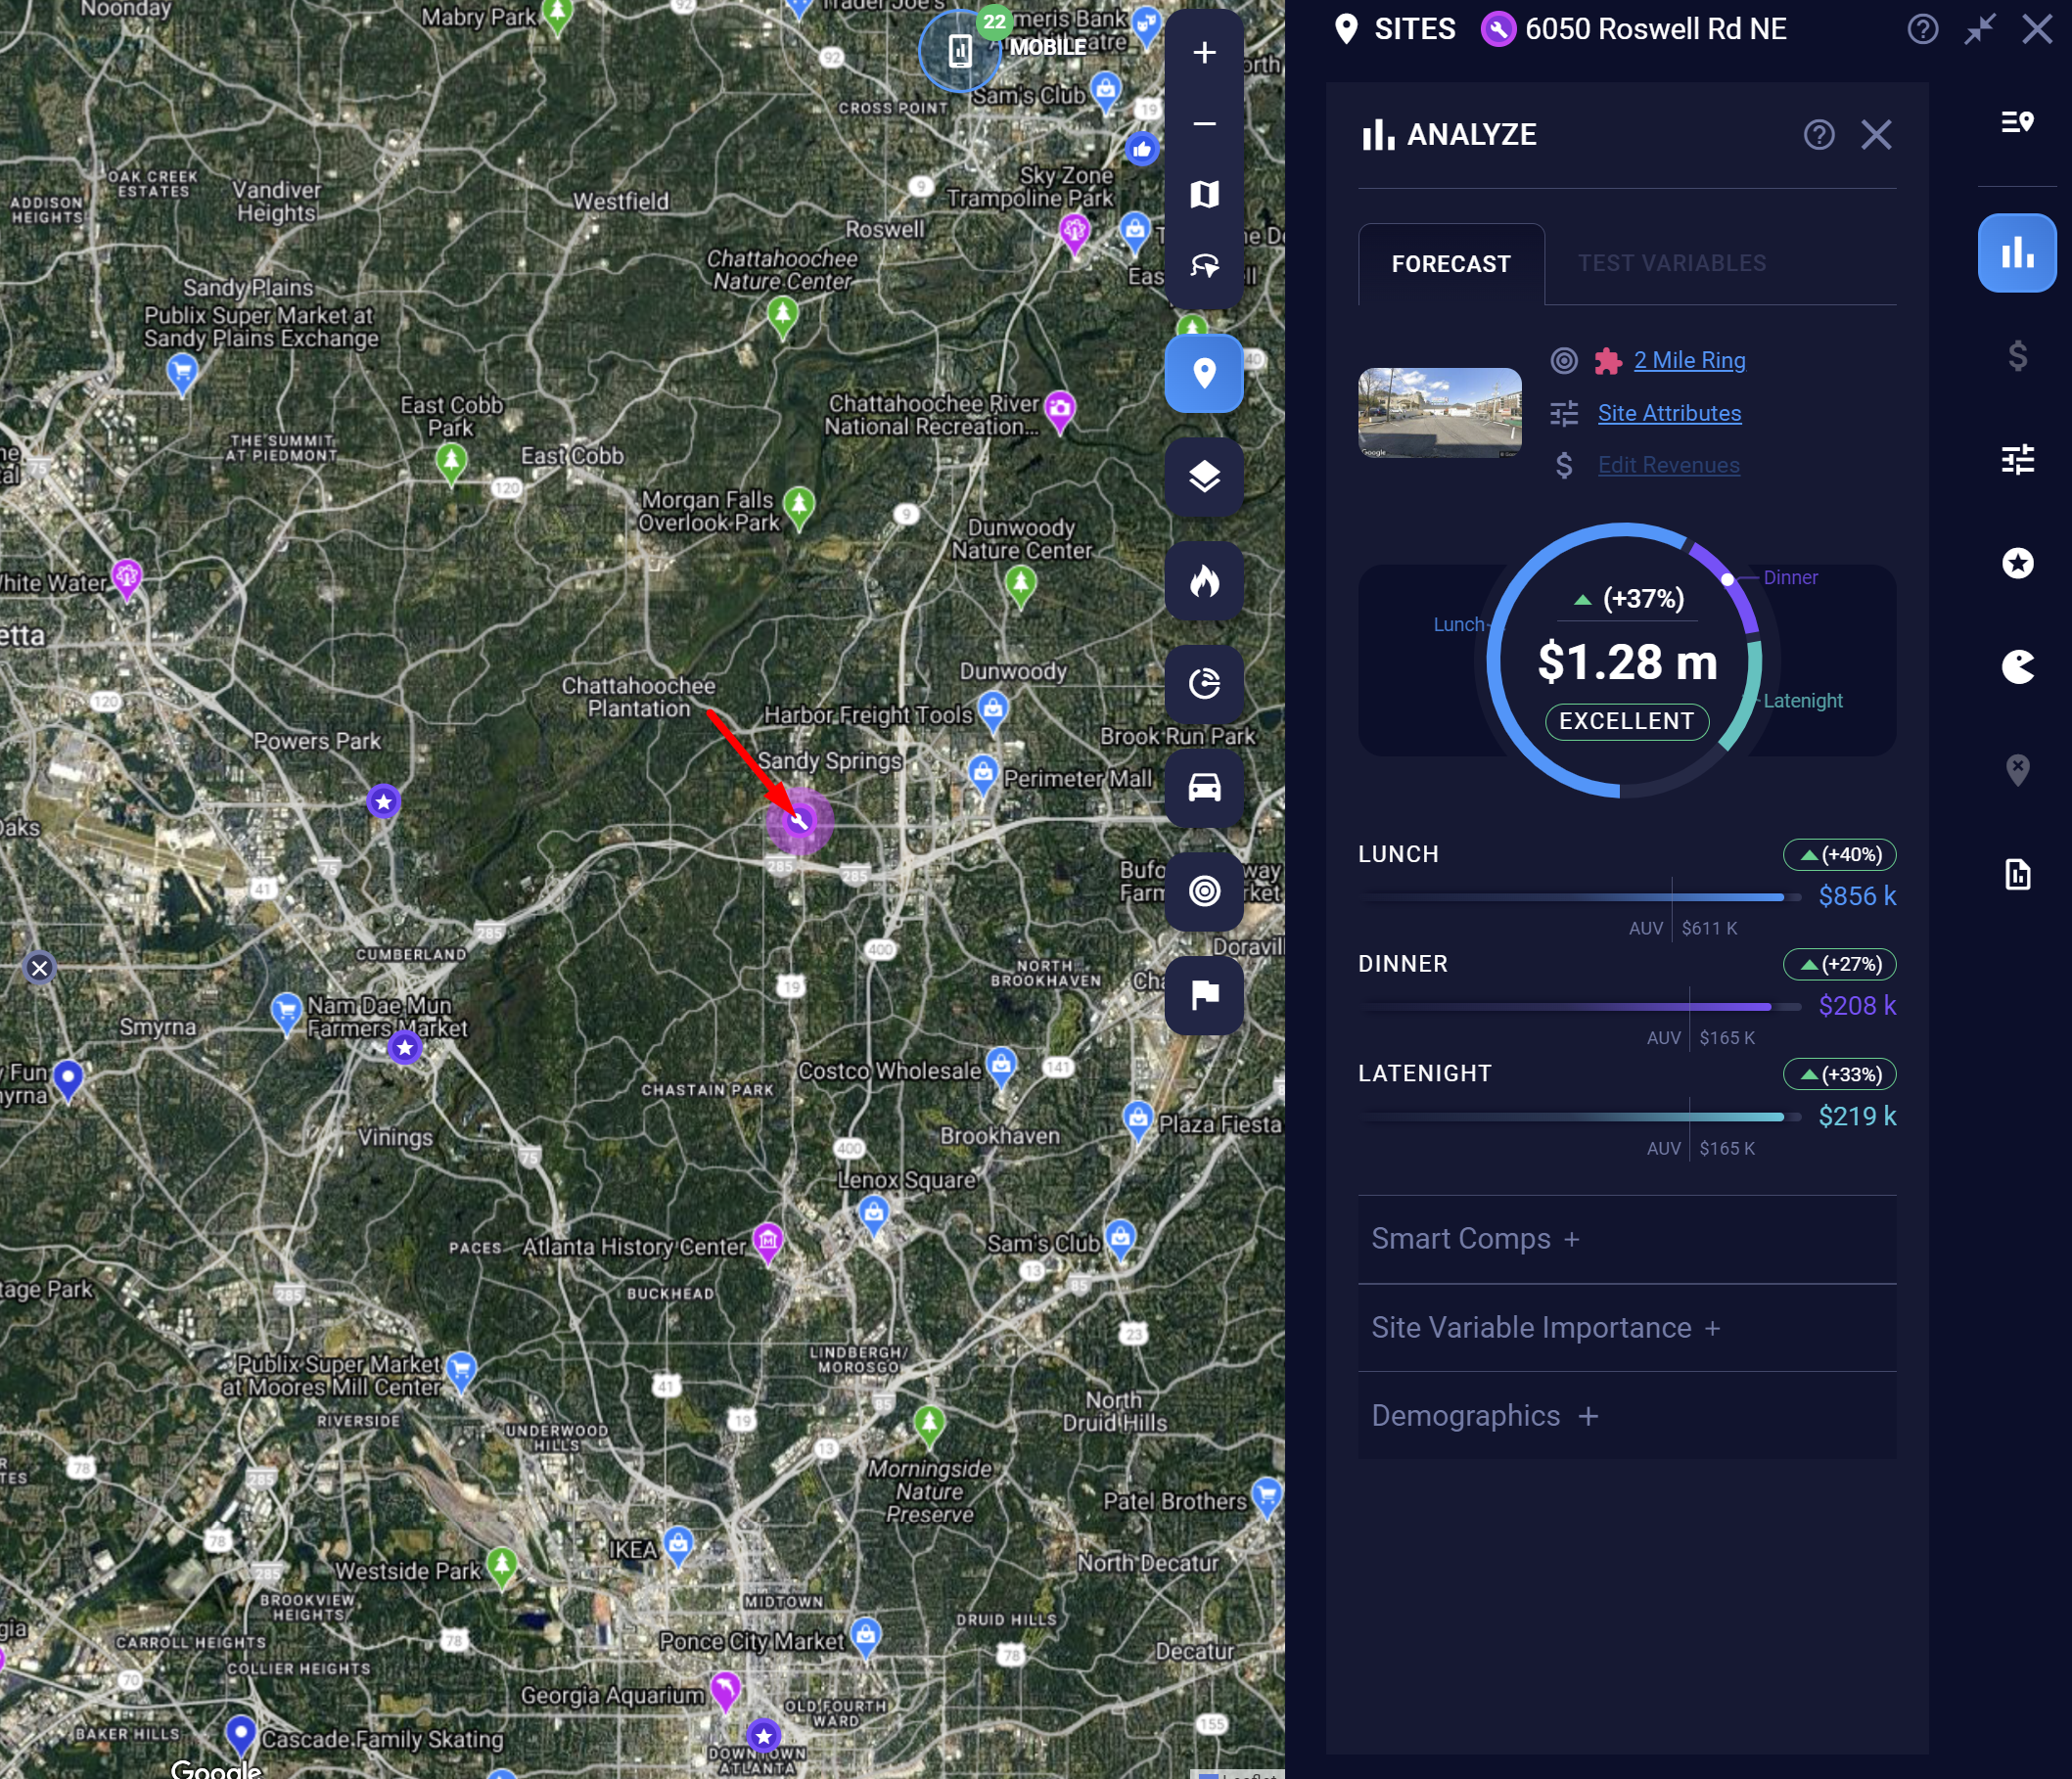
After dropping a pin, click the pin to view the Zeustimate for the location
How to interpret a Zeustimate
Bucketing of the Zeustimate
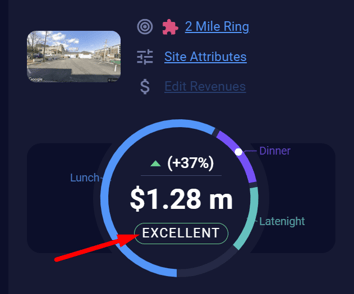
SiteZeus will generate a dollar amount (or count) for the Zeustimate. We recommend paying attention to the bucket the Zeustimate falls into. The bucketing system is based on the average unit volume (AUV). Following the bucket system will guide you to the next steps of your site selection process.
- Excellent: SiteZeus sees great potential in the location. Proceed with reviewing leasing and other details.
- Above average: SiteZeus sees potential in the location. Continue reviewing it.
- Average: SiteZeus sees the location as close to the average locations in your portfolio.
- Below average: SiteZeus projects the site's revenue to be below your portfolio's AUV. Proceed with caution.
- Poor: SiteZeus projects the site's revenue to be well under your portfolio's AUV.
Note: Every subrevenue, such as breakfast, has its own unique fine-tailored model, just like the total revenue model. This allows our machine learning algorithms to focus in on the specific data at hand. The results displayed take the Zeustimates for all these subrevenues, as computed against their corresponding models, and creates ratios by comparing outputs across all subrevenues. These then become portions of the total revenue's Zeustimate.
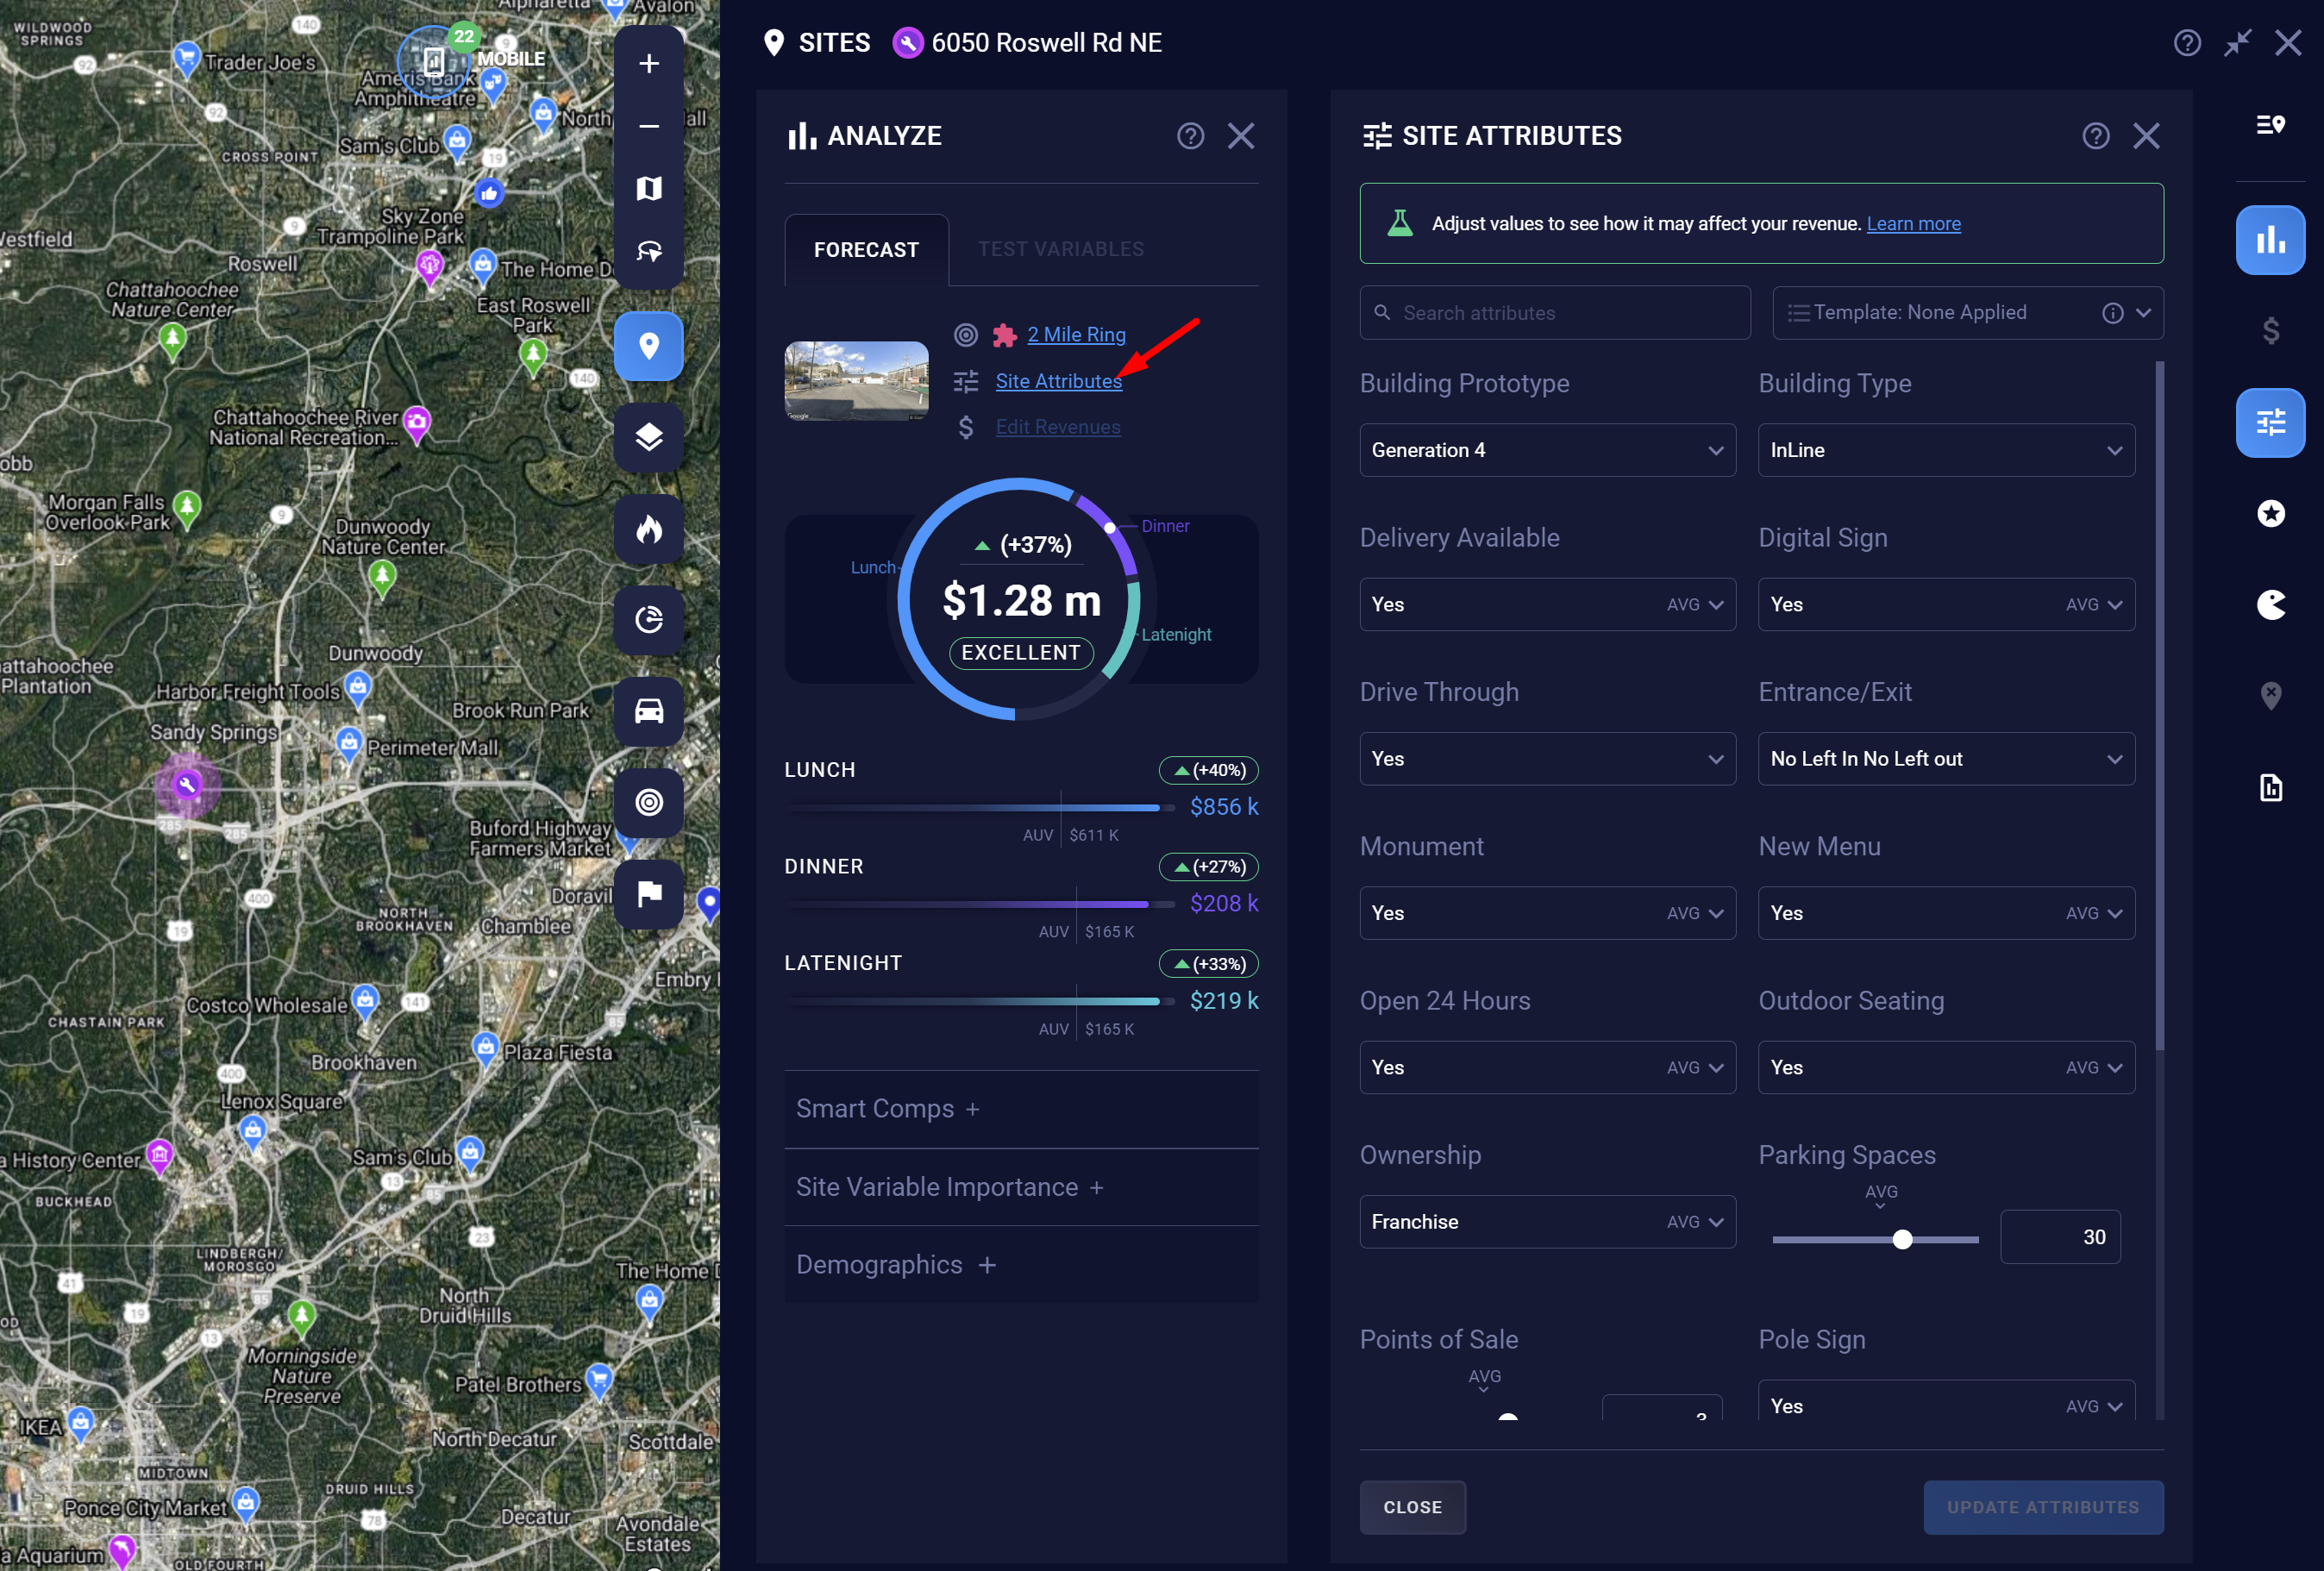
Site attributes
Customize the Zeustimate by adjusting the site attributes to the exact specifications for the location.
Layers
If you have Layers in your project, they may influence your Zeustimate. The Layers need to exist around the location you are projecting on. Using the prebuilt Layer database is a great way to add all Layer locations at once.
Note: Your model will consider Layers based on their count, revenue, and distance from your site.
Variable Impact
The Zeustimate (ZTM) Variable Impact feature at the bottom of the Z-Panel gives you even deeper insight into your model by showing the impact each attribute has on your Zeustimate.
It gives you the starting projection, then adds and subtracts the monetary amounts for each variable used to generate the specific Zeustimate. Remember, not all attributes will be used in each projection.
How to view Variable Impact on a Zeustimate
- Scroll to the bottom of the Zeustimate panel and click on Site Variable Importance.

- Once the panel has expanded, you can view the Site Variable Importance for that location.
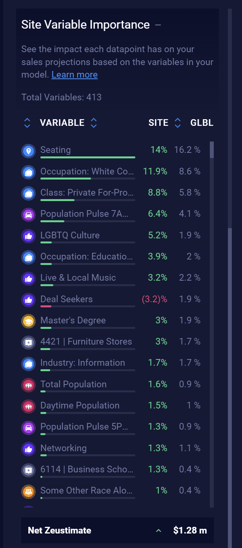
Note: SiteZeus does not tell you if the attribute is positive or negative. For example, variable impact will show Homes $50-$100k with a negative $5,000 impact on the Zeustimate, but not whether this location has too many or too few homes in the $50-$100k price range in its trade area.
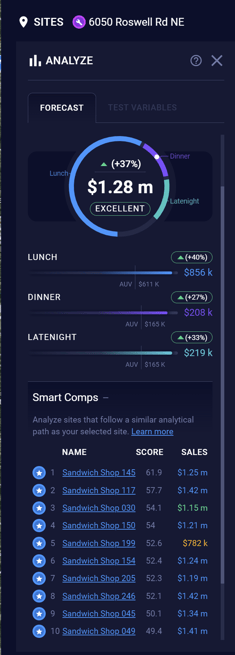
Smart Comps
Smart Comps are sites that went down the same or similar decision-tree paths when the model analyzed them. Comparison sites can be used to review how sites similar to the one you are currently considering have performed.
How to view Smart Comps on a Zeustimate
After you generate a Zeustimate, click Smart Comps below the street view image.
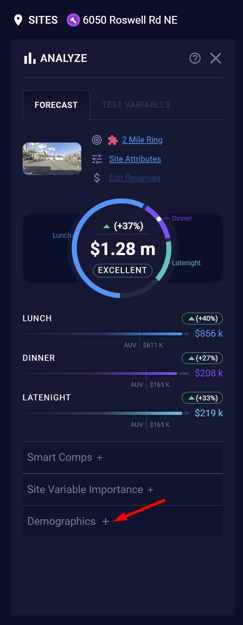
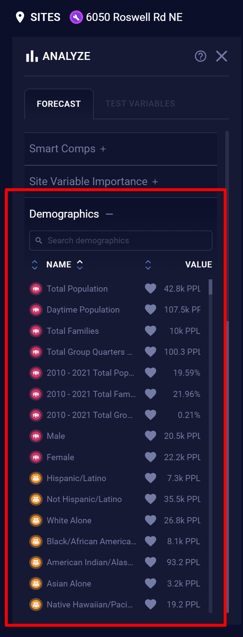
Demographics
From the Zeustimate window, you can access Demographics for a snapshot of all data points for your selected forecasting trade area. Examples of some of those available data points are below. To view the data for alternative trade areas than your forecasting one go to the Trade Areas panel.
- Total Population
- Ethnicity
- Male-to-female ratio
- Ages
- Median income
- Median home value
How to view Quick Demographics for a Zeustimate
The menu with Quick Demographics is located in the Z-Panel below the street view image.
- Select Demographics
- View the demographics for the forecast trade area that you are currently forecasting for
Attribute templates
Attribute templates allow you to quickly adjust site attributes. Create templates for a particular store prototype, a below-average location, an above-average location, or another type of store.
Notes:
- Do not generate a Zeustimate for an Existing Site; instead, use the Quadrant Recommendations to evaluate it.
- A Zeustimate does not take into consideration rent or earnings before interest, taxes, and amortization EBITA, etc.
- Use Smart Comps to find comparable Existing Sites that followed a similar path in the decision trees.