How do I select sites and enter the report wizard?
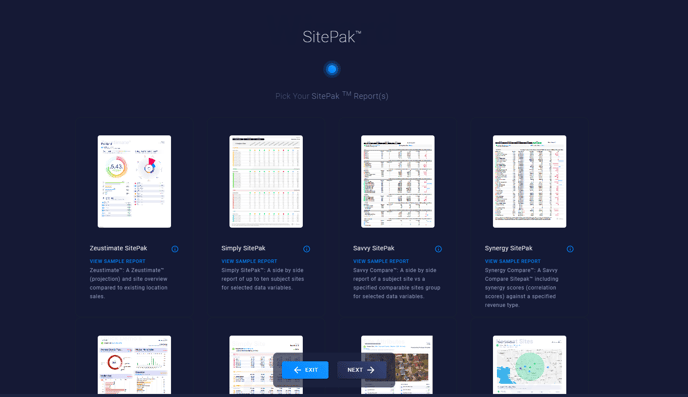
How do I select a report type?
Where can I find my reports after they have been created?
Note: This video doesn't reflect our new user interface, but the principles still apply. Check back for an updated video shortly.
What is the Reporting Wizard?
The Reporting Wizard is your portal to all the reports, currently 9, available in SiteZeus.
- Zeustimate SitePak – The Zeustimate SitePak is a valuable tool when evaluating potential sites.
- Synergy SitePak – This level of reporting utilizes machine learning and organizes your results based on the strength of the correlations found. Synergy reports allow you to compare a subject site with all sites or a subgroup of sites. (Only available to Synergy subscribers)
- Savvy SitePak – Allows you to compare demographics for a subject site with the average of all your sites, or the average of a subgroup of sites. (Available to Savvy and Synergy subscribers)
- Simply Compare – Allows a user to report on a single site with up to 7 trade area sizes side by side for chosen variables.
- Simply SitePak – Allows you to view up to 10 sites, side-by-side, and compare them purely on the demographics of the trade area selected. (Available to subscribers of all levels)
- Quick Demos SitePak – A snapshot of commonly used demographic data presented in an easy to digest graphical style.
- Site Attribute SitePak - Report on Site Attributes and their impact on specified site selection
- Nearest Sites SitePak - Allows you to generate on reports on your existing sites in surrounding area to the location of interest.
- Nearest Layers SitePak - Allows you to gather data on all of the layers in the vicinity of the specified site to assist with more regional data collection.
- Excel Export – You may also choose to export Simply, Savvy and Synergy reports to Excel.
How do I select sites and enter the Report Wizard?
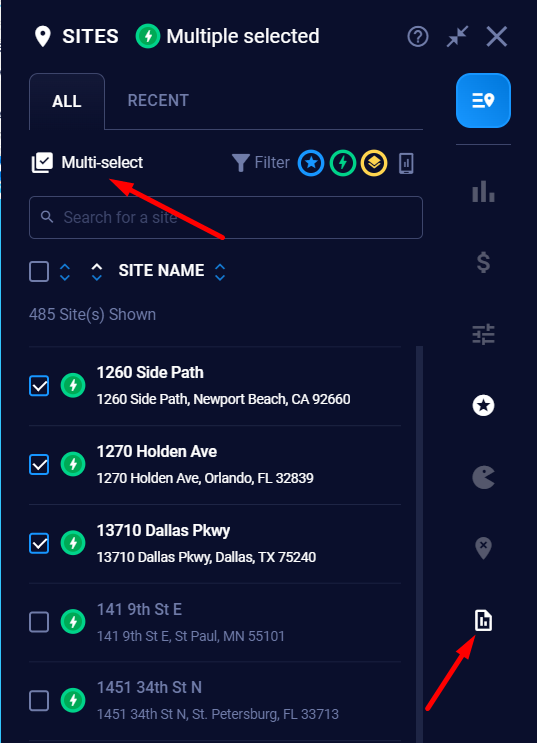
Select one or multiple sites that you would like to generate reports for.
Single Site Report:
- Click on the site on your map or enter the address into the search bar to navigate to the location. This will open a Zeustimate panel.
Multiple Site Report:
- Use the Multi-select feature or Lasso tool to select multiple sites. You may select up to 10 locations to bring into the report wizard.
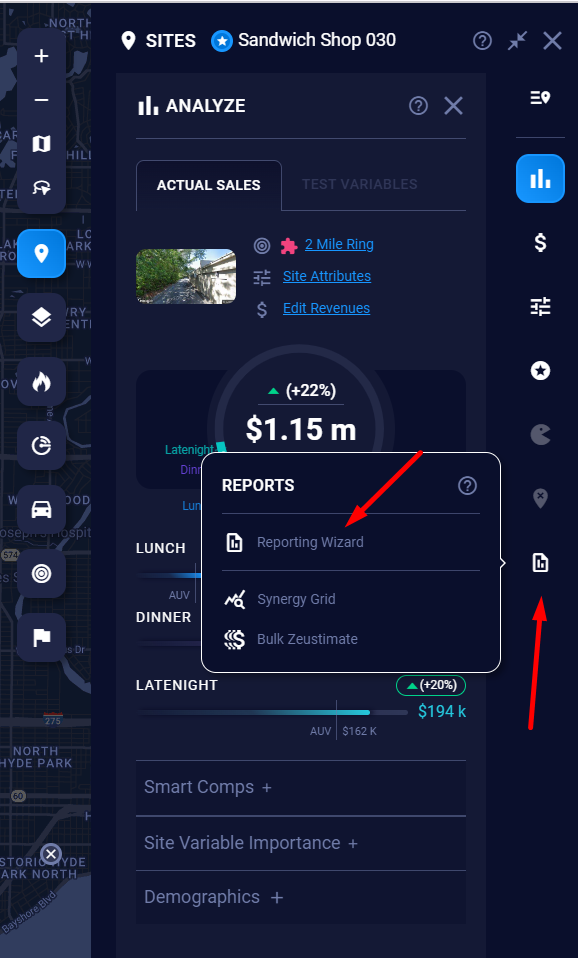
- Now that you have selected your locations, enter the Reporting Wizard by selecting the Report icon
How do I select a report type?
After entering the Report Wizard consider the data that you wish to report and select one of the Reports available (Zeustimate, Simply, Savvy, Synergy, Quick Demos, etc.). If you have created a presentation template, those reports will also be available from this screen.
Where can I find my reports after they have been created?
1. Once you have created a report it will be available in the Saved Reports section of your project menu.
2. Click the Menu button next to the Search Bar in Map view.
3. In the left menu panel, select Saved Reports.
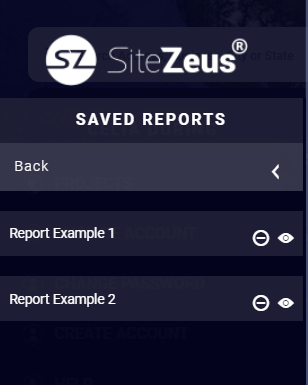
4. You will now see a list of all the reports you have created. You may view them by clicking the eye icon. Or you can delete them by clicking the minus icon.
Note: Learn more about how to run some of the most popular reports.