Use this report when you:
- Want to see data variables for more than one trade area
- Want to have the site's sales forecast displayed on the report
- Want to include more demographic data than what is found in the Zeustimate SitePak
Tip: We recommend using Existing or Proposed Sites for these reports.
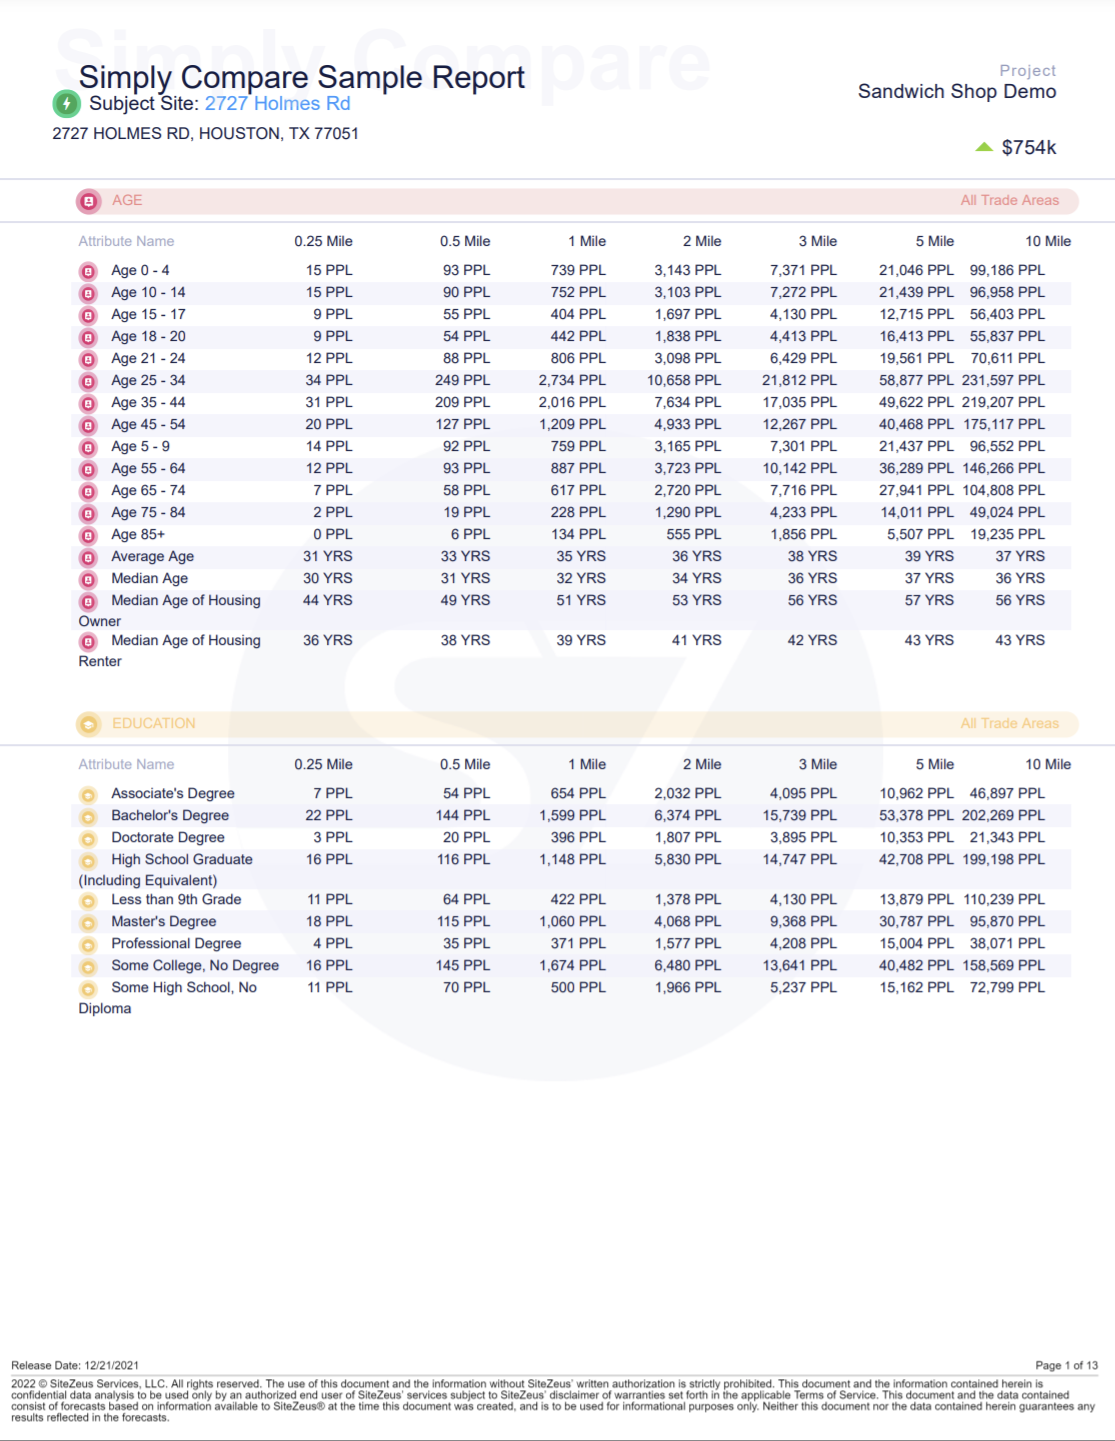
What is included in the report
- Alphabetical listing of the data categories
- The individual data points
- The raw numbers for each of those data points at each chosen trade area
- At the top of the report: The report name, subject site name, address, and project name, along with the Zeustimate (if toggled on)
How to generate this report:
- Select a site.
For a single site:
— Click a pin on the map or enter the address into the search bar to navigate to the site. This will open the Zeustimate panel.
— Click the Report icon in the Zeustimate panel to enter the Reporting Wizard.
For multiple sites (up to 10):
— For pins in close proximity, use the lasso tool.
— For multiple Consideration Sites, use the bolt list, which is to the right of the search bar.
— For pins in different geographic areas, use the multi select technique. Alternatively, hold Shift and Left Click on sites from the map to multi select.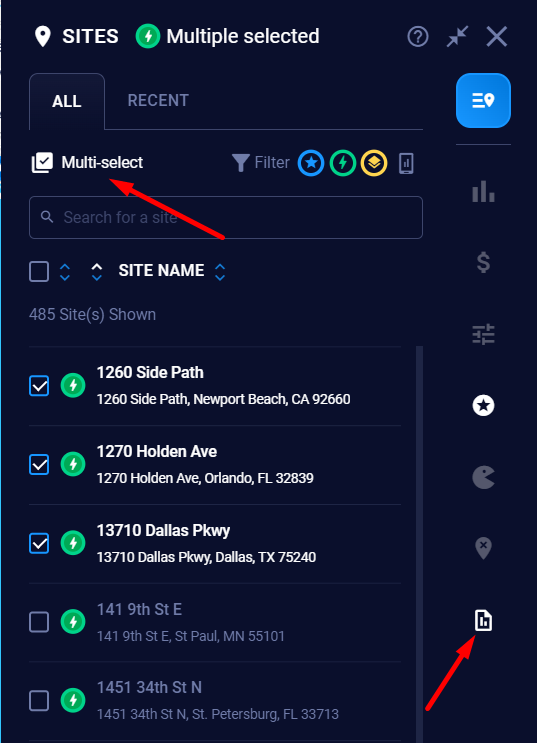
- Select the Simply Compare report in the Reporting Wizard.
- Select the trade area size (¼ mile, ½ mile, 1 mile, 2 miles, 3 miles, 5 miles, or 10 miles).
- Choose the attributes you want to include: Select all categories (which will be set to the default values), your favorited categories, or an individual category.
- Name and export the report
- Toggle the Zeustimate on or off.
-
- Export the report as a PDF document, Excel workbook, or both.
Notes:
- The PDF report shows data categorically, with the subject sites highlighted at the top, along with their address and Zeustimate. The report type, trade area size, and attributes selected are shown at the top of the report.
- The Excel workbook shows the location name, site context, trade area size, and the attributes selected in columns. Each attribute consists of two columns: the count (directly below the attribute name) and the percentage (to the right of the attribute).