Quick Demo’s SitePak:
1. Click on the Quick Demo’s SitePak Icon from the Report Selections Screen and then click Next.
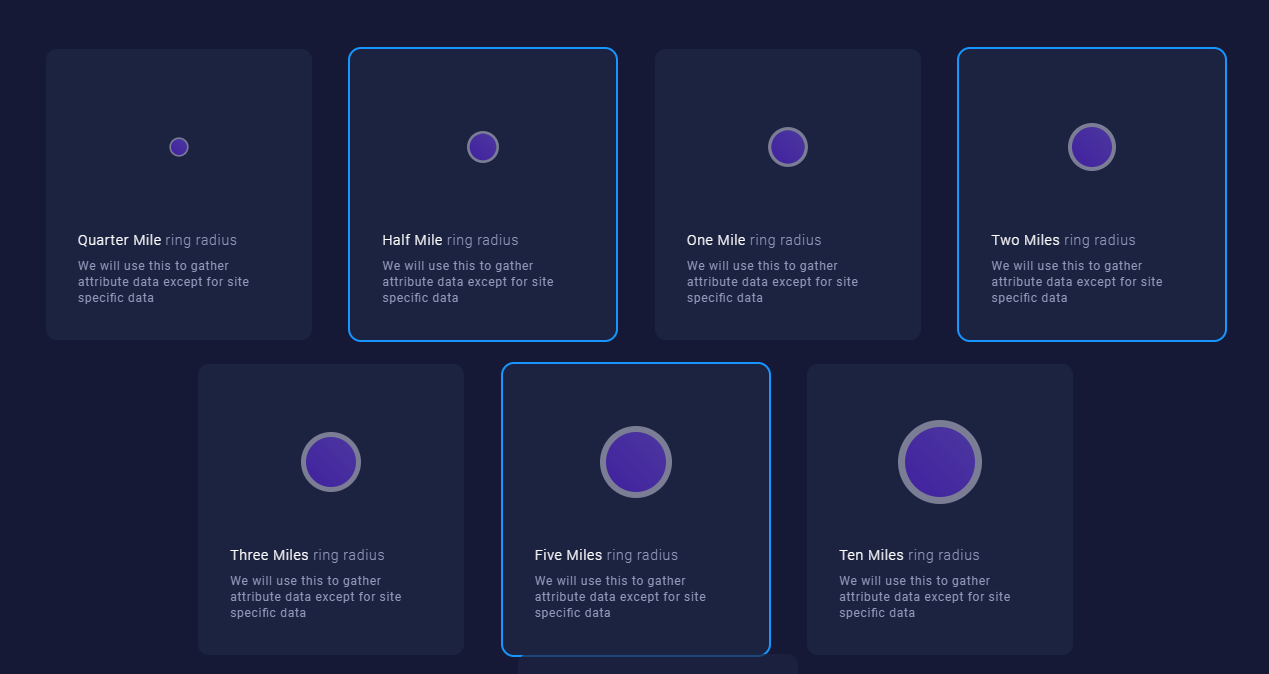
2. Select a trade area to analyze.
3. Name your Report and click Next or Create Template if you plan to create similar reports in the future.
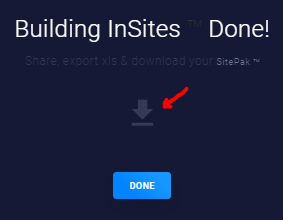
4. After a moment, your report will be ready. When you see the Message “Building InSites Done” you may click the Download button to access your report.
5. Click Done to return to the report selection screen. If you forgot to download your report, don’t worry! We automatically save the reports you create under the SitePak section of the main menu. Refer to the Reporting Basics/Overview article to see how.
Simply SitePak:
1. Click on the Simply SitePak Icon from the Report Selections Screen and then click Next.
2. Select a trade area to analyze.
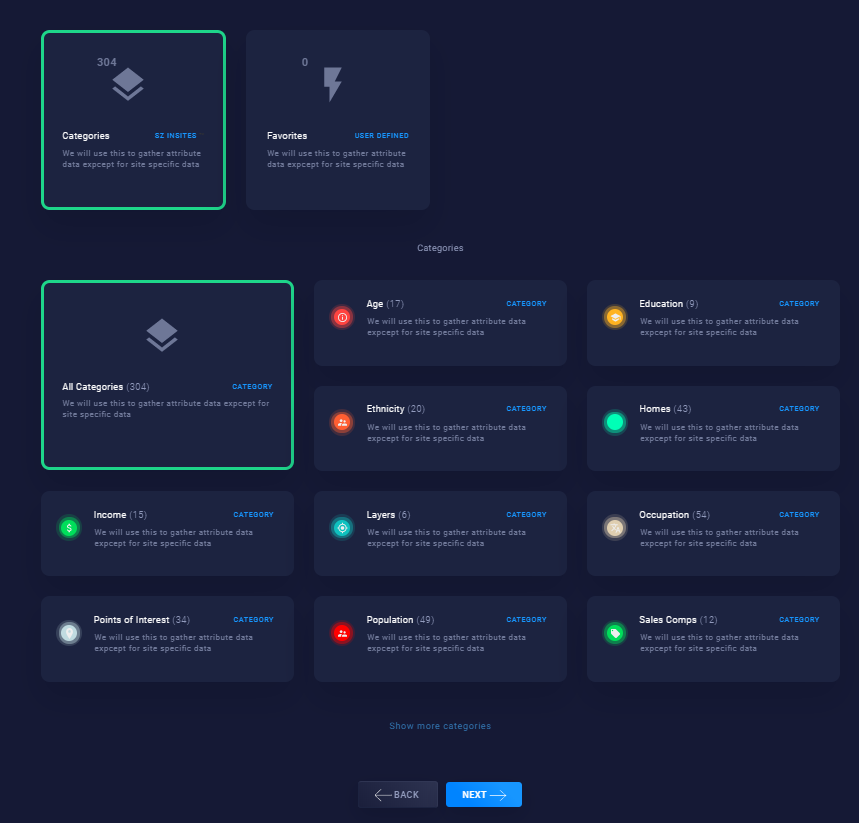
3. On the next page, you should select whether you would like to view all data available (Categories) or only your favorite attributes (Favorites).
- You may further refine your selection by choosing only specific categories below.
- For example, selecting Favorites and then Ages will create a report that only has the attributes in the Ages category that you have defined as favorites.
4. Name your Report and click Next or Create Template if you plan to create similar reports in the future.
.gif)
5. After a moment, your report will be ready. When you see the Message “Building InSites Done” you may:
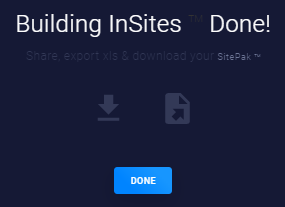
- Click the Download button to access the PDF version of your report.
–Or–
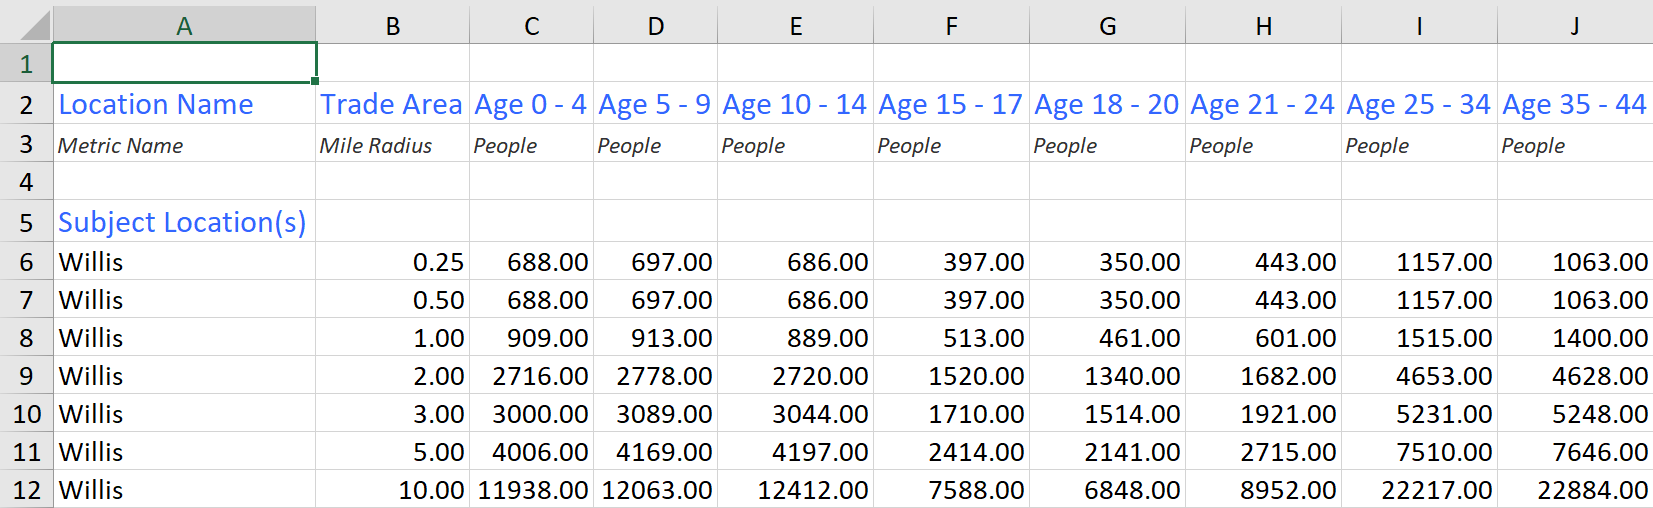
- Click the Export to Excel option to generate a spreadsheet.
7. The excel export option will provide details from every category you have selected, across all the available trade areas for your Subject Locations.
8. Click Done to return to the report selection screen. If you forgot to download your report, don’t worry! We automatically save the reports you create under the SitePak section of the main menu. Refer to the Reporting Basics/Overview article to see how.
Savvy SitePak:
1. Click on the Savvy SitePak Icon from the Report Selections Screen and then click Next.
2. Select a trade area to analyze.
3. On the next page, you should select whether you would like to view all data available (Categories) or only your favorite attributes (Favorites).
4. You may further refine your selection by choosing only specific categories below.
5. For example, selecting Favorites and then Ages will create a report that only has the attributes in the Ages category that you have defined as favorites.
6. Savvy SitePak is a comparison report, so next step we need to select which sites we would like to compare to our Subject Sites.
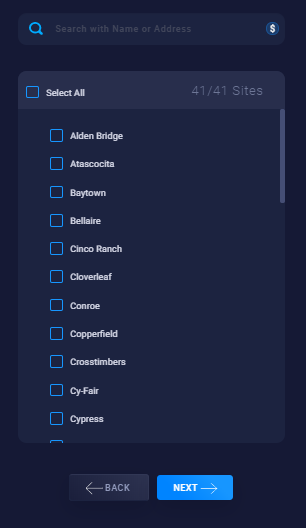
7. The sites you select on this screen will be represented by the Average Sites in your report.
8. If you click on the Dollar Sign in the Search Bar, on the site selection page, you can select sites by:- Top 10 (Rank Count by Total)
- Top 10% (Rank Percent by Total)
- Bottom 10 (Rank Count by Total)
- Bottom 10% (Rank Count by Total)
9. Name your Report and click Next or Create Template if you plan to create similar reports in the future.
10. After a moment, your report will be ready. When you see the Message “Building InSites Done” you may:
- Click the Download button to access the PDF version of your report.
–Or–
- Click the Export to Excel option to generate a spreadsheet
Notes:
- The excel export option will provide details from every category you have selected, across all the available trade areas for your Subject Locations.
- Additionally, the Selected Sites that you have picked in step 4 will appear under the Selected Location(s) header:
Zeustimate SitePak:
1. Click on the Zeustimate SitePak Icon from the Report Selections Screen and then click Next.
2. Name your Report and click Next or Create Template if you plan to create similar reports in the future.
3. After a moment, your report will be ready. When you see the Message “Building InSites Done” you may click the Download button to access your report.
4. Click Done to return to the report selection screen. If you forgot to download your report, don’t worry! We automatically save the reports you create under the SitePak section of the main menu. Refer to the Reporting Basics/Overview article to see how.
Synergy SitePak:
1. Click on the Synergy SitePak Icon from the Report Selections Screen and then click Next.
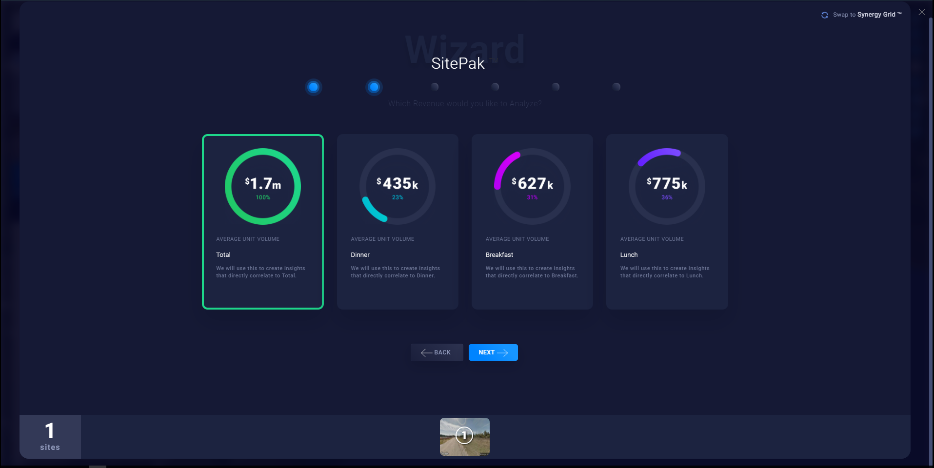
2. Pick which revenue you wish to include in the report as your first option.
3. Select a trade area to analyze.
4. On the next page, you should select whether you would like to view all data available (Categories) or only your favorite attributes (Favorites).
- You may further refine your selection by choosing only specific categories below.
- For example, selecting Favorites and then Ages will create a report that only has the attributes in the Ages category that you have defined as favorites.
5. Synergy SitePak is a comparison report, so next step we need to select which sites we would like to compare to our Subject Sites.
6. The sites you select on this screen will be represented by the Average Sites in your report.
7. If you click on the Dollar Sign in the Search Bar, on the site selection page, you can select sites by:
- Top 10 (Rank Count by Total)
- Top 10% (Rank Percent by Total)
- Bottom 10 (Rank Count by Total)
- Bottom 10% (Rank Count by Total)
8. Name your Report and click Next or Create Template if you plan to create similar reports in the future.
9. After a moment, your report will be ready. When you see the Message “Building InSites Done” you may:
- Click the Download button to access the PDF version of your report.
–Or–
- Click the Export to Excel option to generate a spreadsheet
Notes:
- The excel export option will provide details from every category you have selected, across all the available trade areas for your Subject Locations.
- Additionally, the Selected Sites that you have picked in step 4 will appear under the Selected Location(s) header.
10. Click Done to return to the report selection screen. If you forgot to download your report, don’t worry! We automatically save the reports you create under the SitePak section of the main menu. Refer to the Reporting Basics/Overview article to see how.