Sales forecasts | Site attributes | Quick Demographics | Smart Comps
Mobile data | Customer segmentation
Sales forecasts
- Click an existing bolt or drop a new pin on the map to see the revenue projection, or Zeustimate, in the Analyze Panel.
- See how the forecast compares to your average unit volume based on its ranking of Excellent, Above Average, Average, Below Average, or Poor.
- Convert to location to one of the saved proposed site types.
- Adjust the site's attributes to refine the forecast for the location.
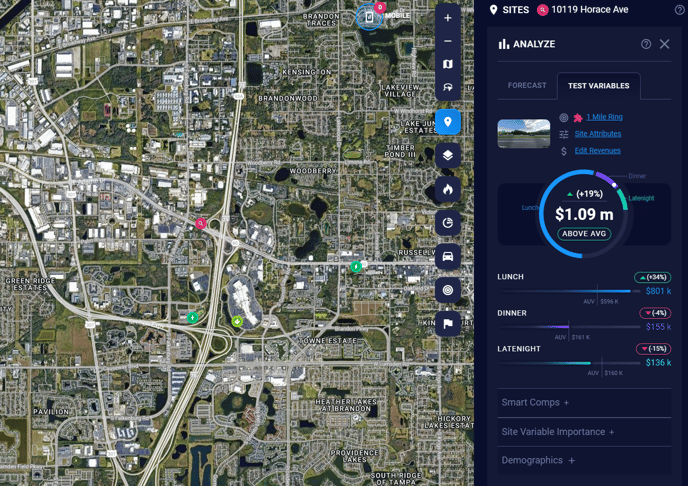
After dropping a pin, click it to view the location's Zeustimate.
Site attributes
- Click the Site Attributes in the top section of the analyze panel to customize the Zeustimate by adjusting the site attributes to the exact specifications for the location. By default your attributes will be set to the average values.
- After changing the attributes for a Consideration Site, click Test Attributes to see an updated sales projection.
Quick Demographics
Click the Demographics menu at the bottom of the Analyze Panel to open the Quick Demographics feature, which provides deeper insight into the demographic data of each trade area. Use the Quick Demographics panel to switch between the different trade-area sizes.
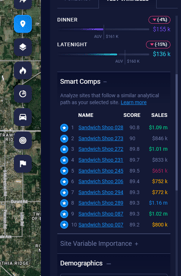
Smart CompsWith Smart Comps, you can see which ten sites in your portfolio most closely resemble the one you're analyzing and quickly compare their performance. These comparison sites traveled down the same or similar decision-tree path when being analyzed by the model. More consistency among comp sites indicates a higher confidence from the model. |
|
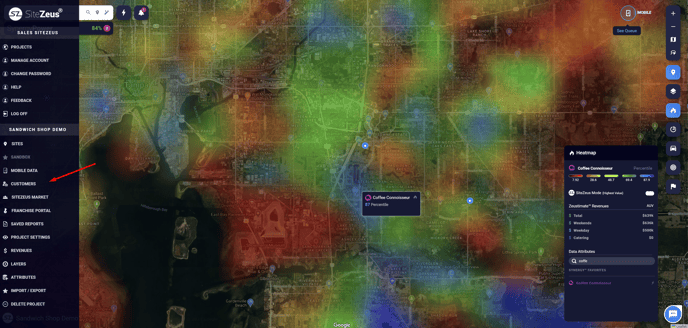
Mobile data
Mobile data is a powerful resource that provides detailed information about the activity around a site.
- To use and evaluate mobile data, activate the mobile data feature using the button in the top-right corner of the map and redeem a token on a site. You’ll be able to view the site in the Mobile Data Dashboard to check its status.
- Once the mobile data for a site has been processed, you can use it for trade-area visualizations, customer segmentation, or sales impact analyses.
You can leverage mobile data to visualize your sites' true trade areas by mapping path-to-purchase data and dynamic trade-area polygons.
You can use the Device Activity slider in the legend to filter this data by time or day. |
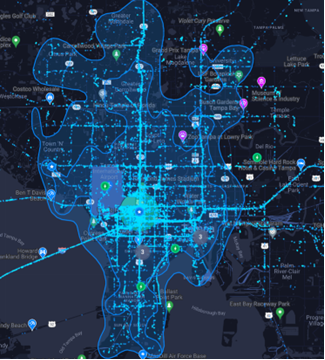 |
Note: These filters only affect the path-to-purchase visualizations, not the trade-area polygons.
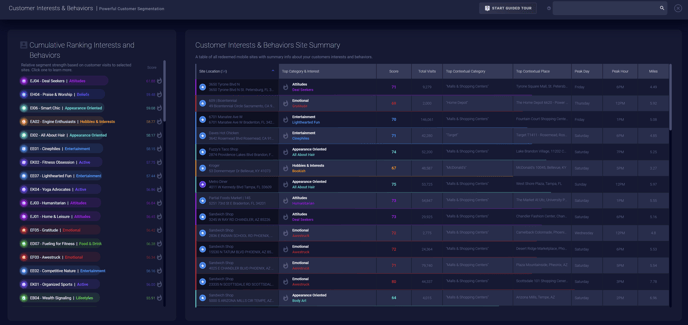
Customer segmentation
After redeeming mobile data for a site, you can dive deeper into the data with the Customer Segmentation Dashboard, accessible through the Customers tab in the Main Menu.
- Select the site(s) you'd like to analyze. By default, the dashboard will include all sites with mobile data redeemed.
- The Cumulative Ranking Interests and Behaviors section on the left will display the primary customer segments from most to least prevalent for all selected sites with mobile data.
- The Customer Interests and Behaviors Site Summary on the right will display additional data for your selected sites, including their Top Category & Interest, Score, Total Visits, Top Contextual Category, Top Contextual Place, Peak Day, and Peak Hour.