Overview
Competitors and synergistic brands can be included in your model as layer sites that visualize their locations. These layer sites play a role in the overall model and in the forecasting of proposed sites. SiteZeus’ machine-learning algorithm accounts for layers in three ways: count, average distance, and average revenue (optional). Understanding why brands are chosen for layer sites, how they influence the model, and how they impact performance is important for users to efficiently analyze synergistic brands or competitors.
Viewing synergistic brands and competitors
Locate synergistic brands or competitors in one of the following three ways:
- View the layer sites in the model
A model can have up to twenty layers and each layer is considered when forecasting. To add layers to a model, there are two methods.- Adding layers through the points-of-interest database and layers panel in the Main Menu.
- Adding layers using the importer and a formatted data sheet.
Learn more about layers
- Search in a particular area using the magnifying glass
Searching using the magnifying glass will return up to twenty results around the area of the map being viewed.- Center your map on the area desired.
- Type the brand or competitor in the search box.
- Click the magnifying glass or press Enter to view the results.
- Search using the magic wand
To search around your existing locations, the magic wand search will allow you to view results within ten kilometers of your blue star pins and up to twenty results per blue star pin.-
- Type the brand or competitor in the search box.
- Click on the Magic Wand icon to search and view the results.
-
Learn more about searching for layers
Analyzing synergistic brands and competitors
Analyze synergistic brands or competitors in one of the following three ways:
- Analyze the layers in the model
The three variables considered in the model for each layer are the total count of layer locations, the average distance between the layer locations and the existing sites, and the average revenue (if applicable). All the variables are considered within a certain trade area and influence the forecasts in the model. - Analyze your layers using the Synergy Grid
View the correlation between performance and your layer sites for the 3 data points for each layer group (count, distance, average revenue (if applicable)) by selecting the Layers group in the Synergy Grid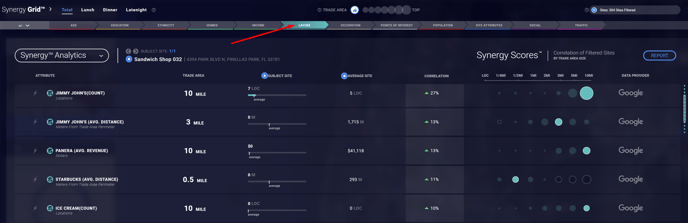
- When interpreting these results typically the more positively correlated the count data point is for each layer, the better your sites perform when that brand is located near your locations
- A positive correlation of 30% is typically considered the base for significance
- Evaluate the distance correlations to identify what the average distance is between your sites and each of your layer brands across your portfolio or for a specific subset of sites

Learn more about the Synergy Grid
- When interpreting these results typically the more positively correlated the count data point is for each layer, the better your sites perform when that brand is located near your locations
- Analyze the layers through the reporting wizard
Viewing and analyzing nearby competitors or businesses can be useful for generating insight on an existing or potential site. When layers are in a model, there is one primary report that provides information on them.- The Synergy SitePak report contains the layers category under the attributes and can be selected to export the data on count, average distance, and average revenue (if applicable) for a specific trade area or all trade area rings.
- This report can also show information about all data variables from subscribed data bundles, including demographics, traffic data, psychographics etc.
- The Synergy SitePak report contains the layers category under the attributes and can be selected to export the data on count, average distance, and average revenue (if applicable) for a specific trade area or all trade area rings.