Overview
Have you ever wanted to know which trade areas have the greatest population during a specific timeframe? Or determine how to adjust your store hours based on local traffic? Thanks to SiteZeus' partnership with our mobile data provider, you can easily answer these questions and share your results.
Population-Movement data set is built using nationwide observations of over 170 million mobile devices during a three-month period. We estimate this covers about 60 to 70 percent of all adults in the United States. The data is measured in cell phone counts that represent the sample population for a given time period.
Tip: You can access this data through a data-bundle subscription in Manage Account. If you do not have access to the Manage Account section, please see your SiteZeus administrator.
Reporting and Synergy Grid
Reporting
On the Attributes selection page of the Reporting Wizard, select Traffic under more categories, then continue through the workflow to create a PDF or CSV report.
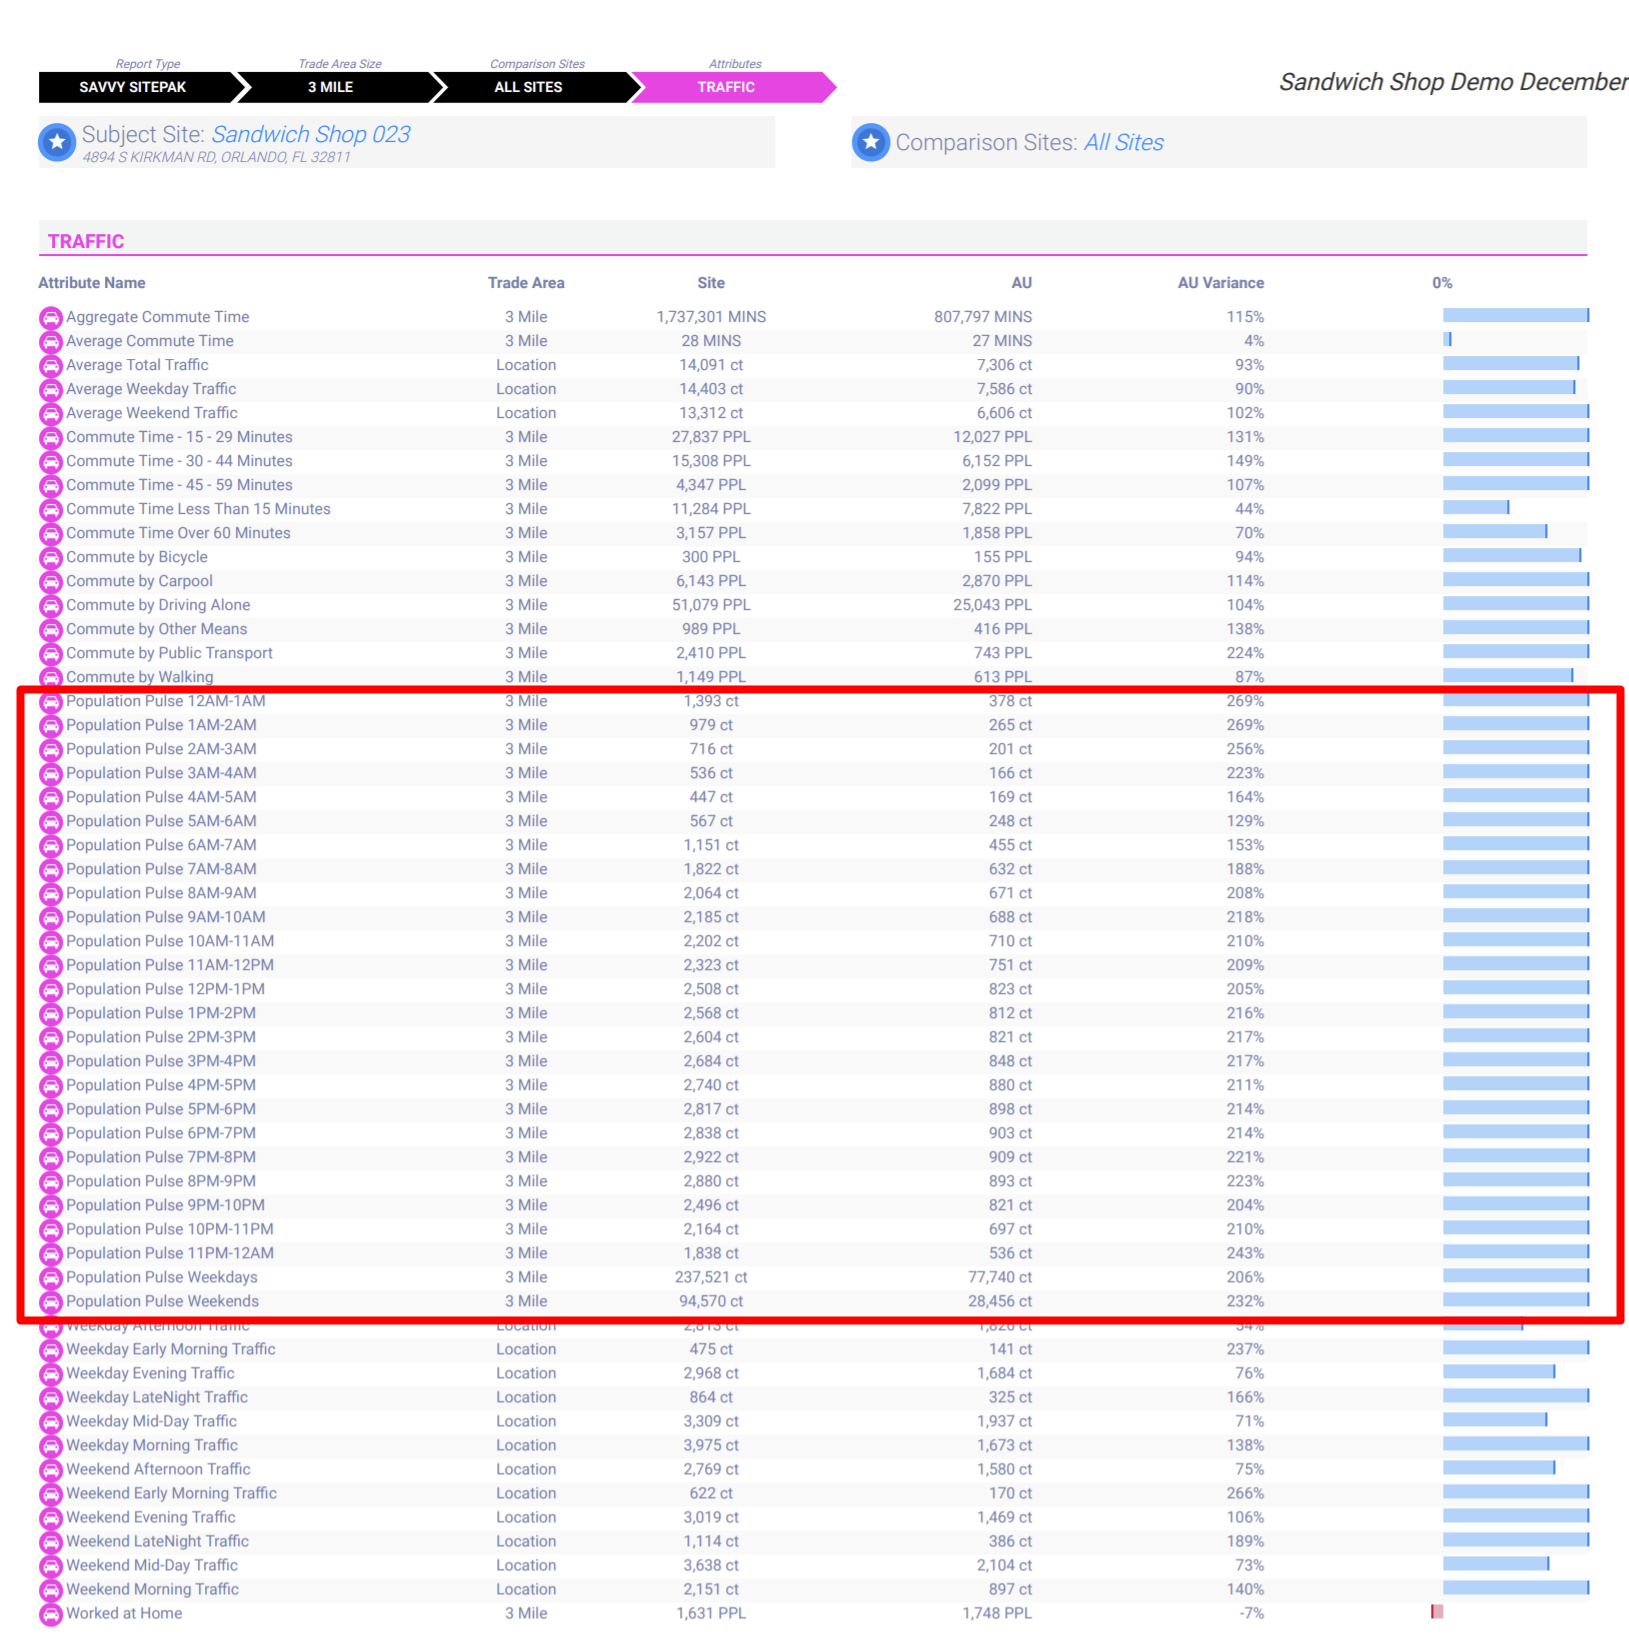
Sample Savvy SitePak report with Population-Movement data
Synergy Grid
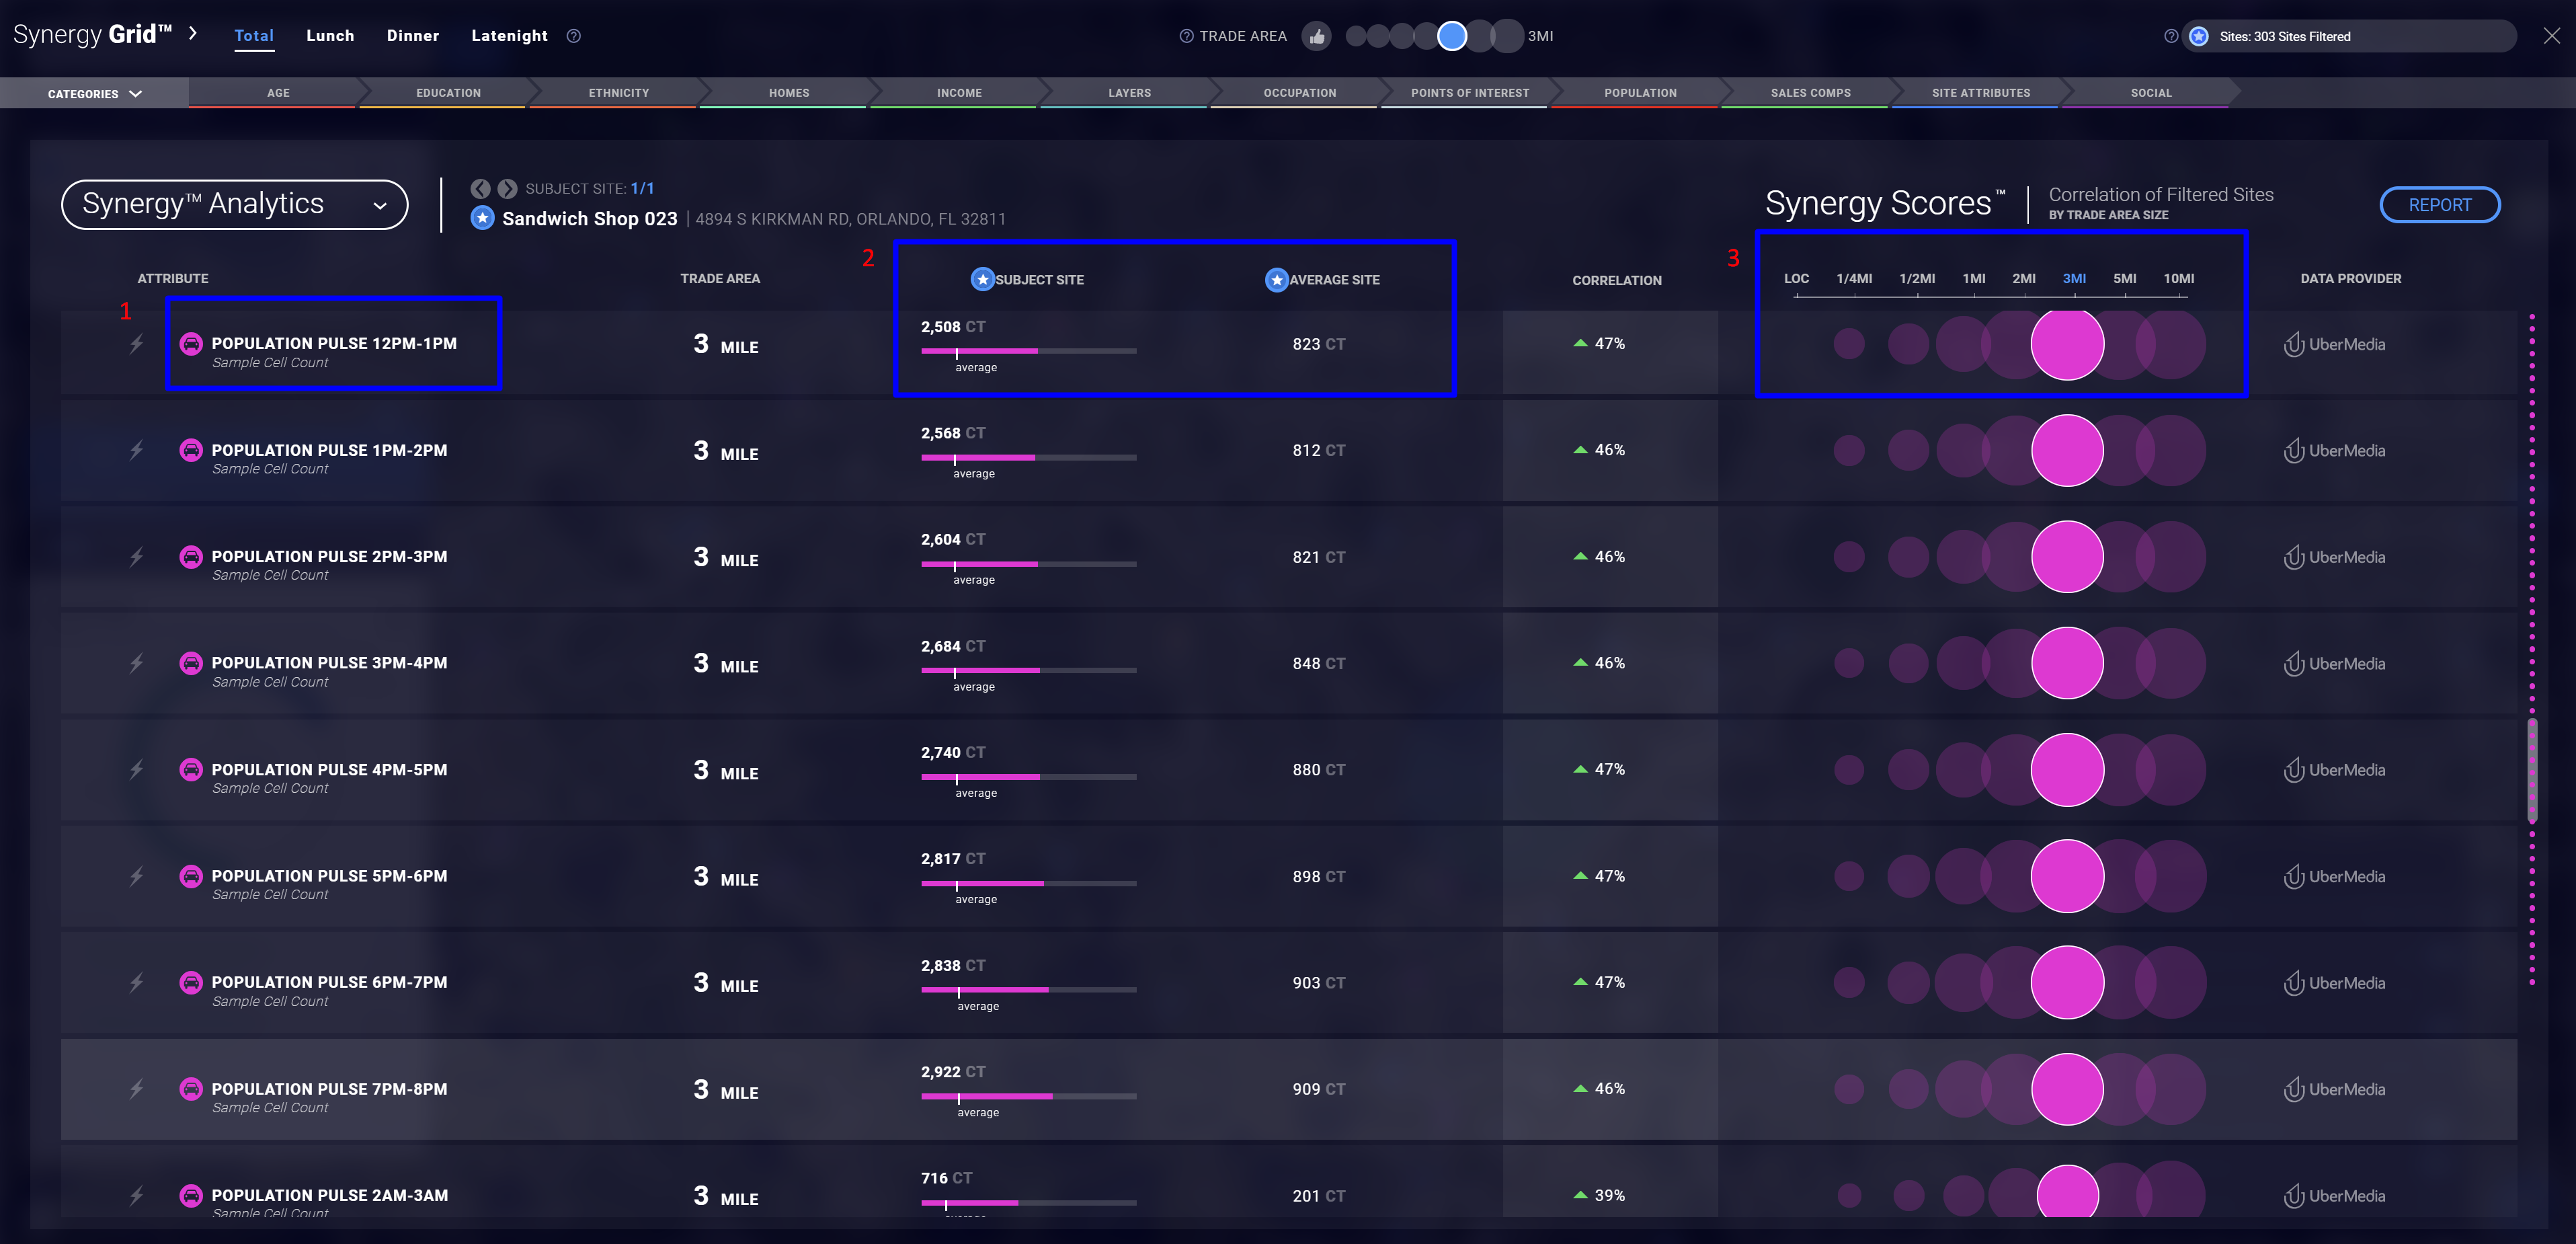
- The Attributes column shows the counts by each hour of the day.
- You can also compare the counts for the subject site to the average counts for all your existing locations and filter the list of sites included in the average in the top-right corner.
- Under Subject Site and Average Sites, you'll see the cell phone count for the sample population in the selected trade area.
- Use the filter in the top-right corner of the Synergy Grid to select the locations used in the average-site calculation.
- Hover over the trade-area rings to see their counts, or use the trade-area buttons at the top of the Synergy Grid to change the trade area displayed. The thumbs-up trade area is the one that ranks the highest for the selected data point.
After filtering the data, click the Report button in the top-right corner of the Synergy Grid and follow the prompts to name and view your report.
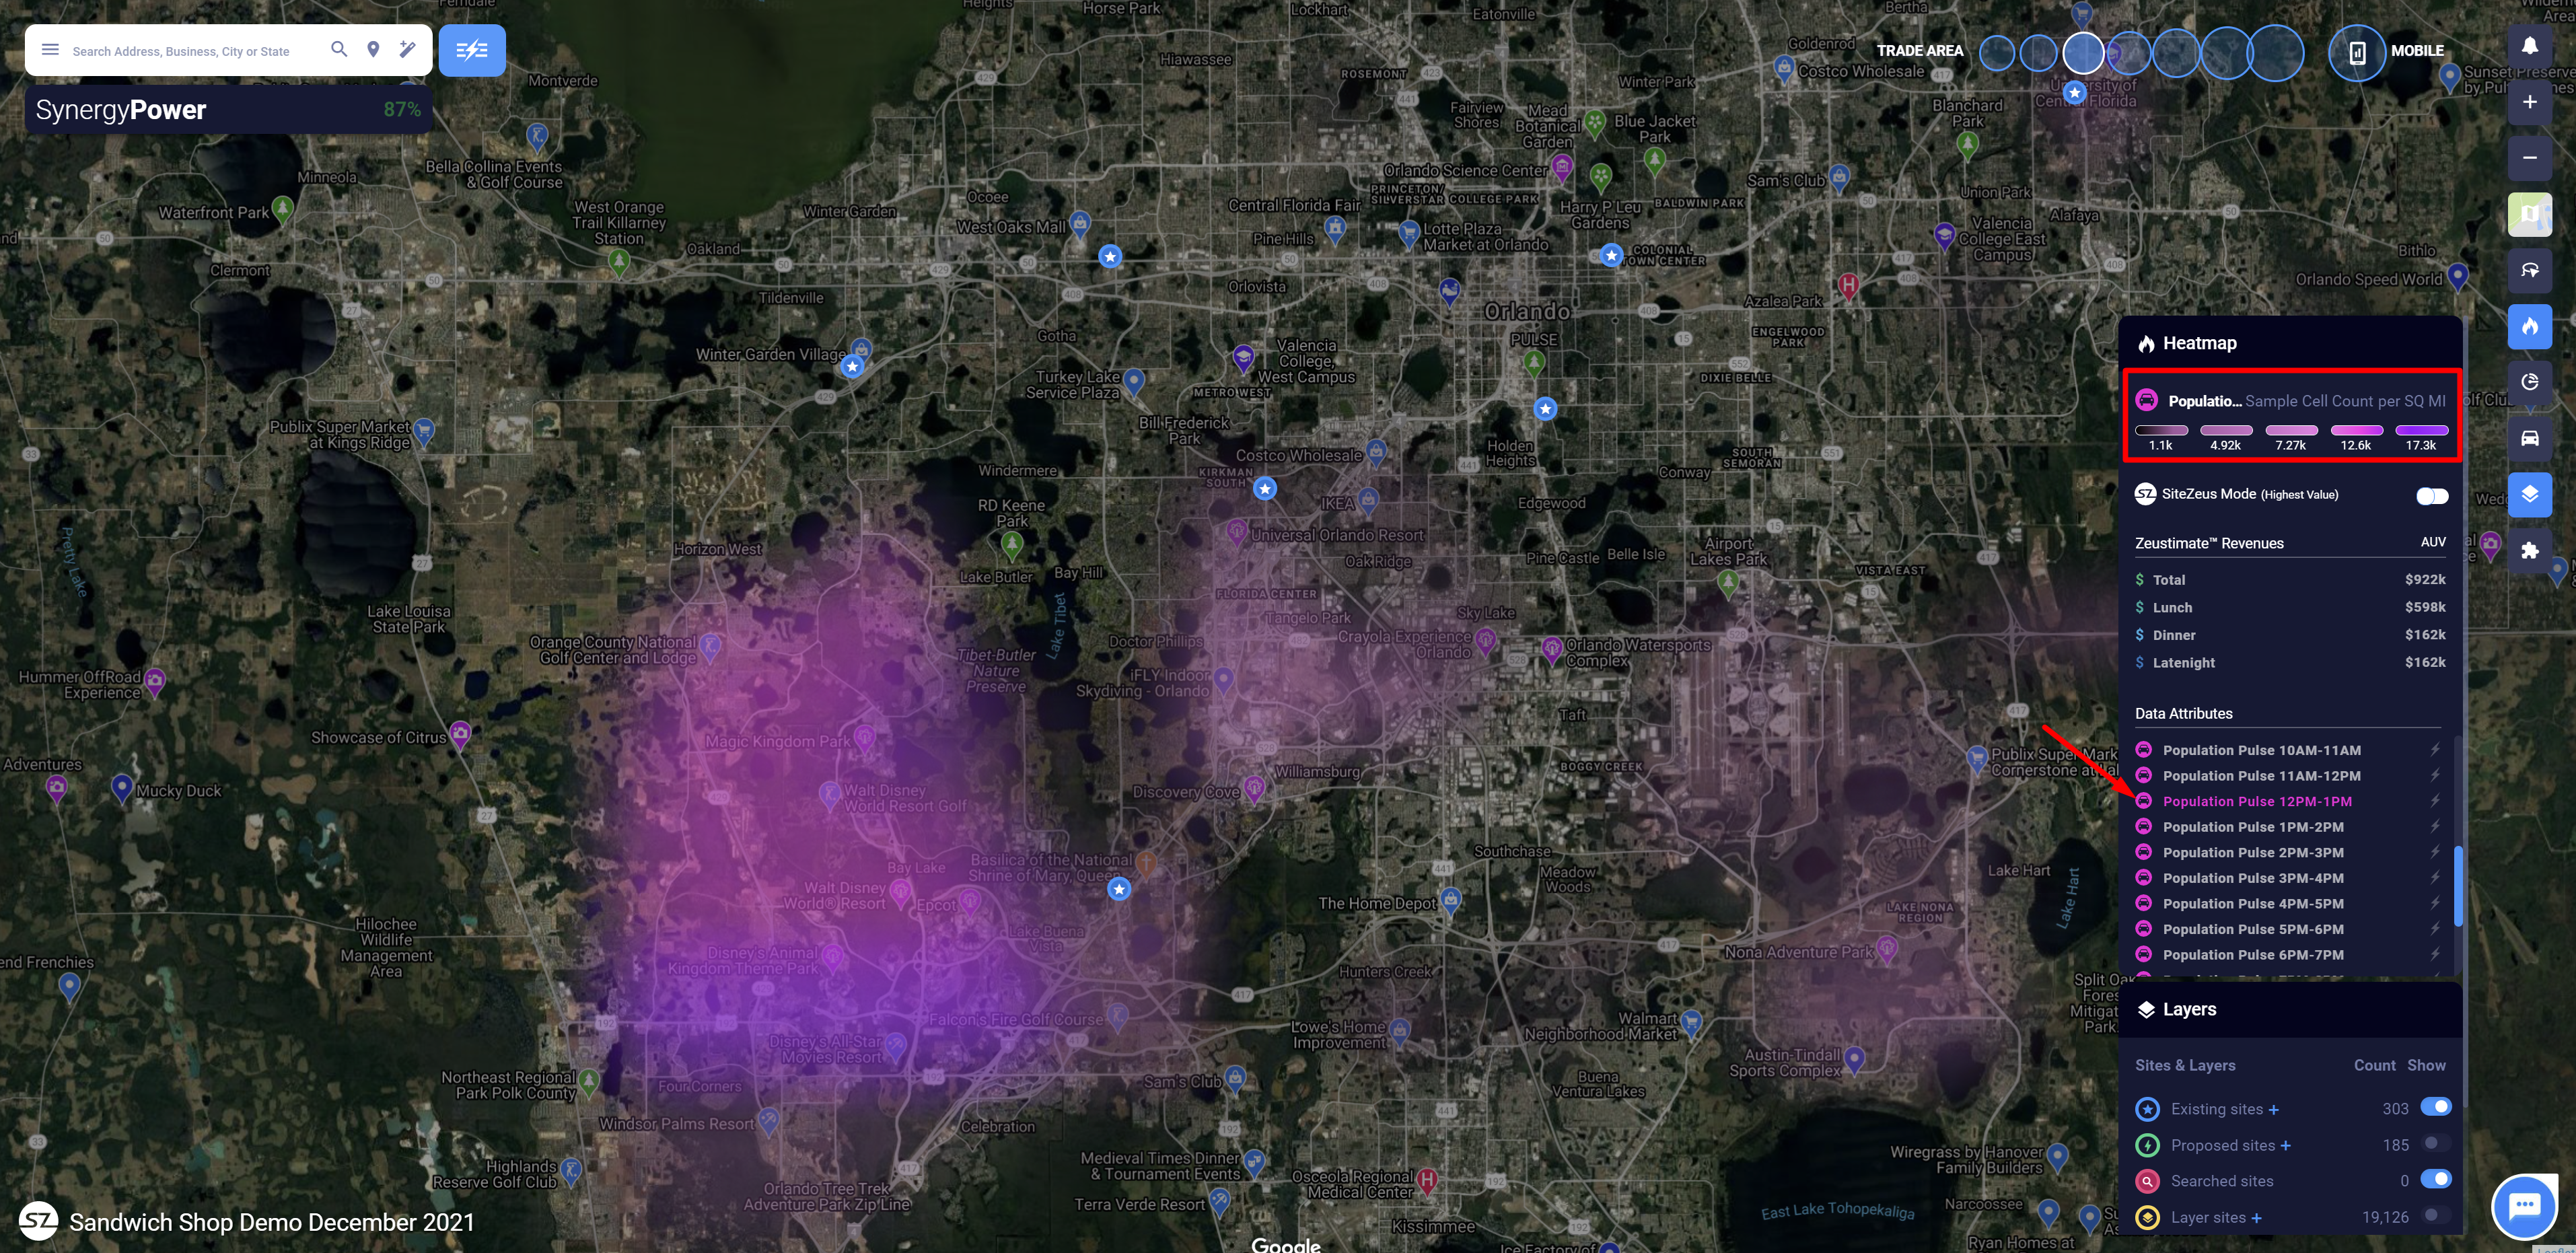
Generating heat maps
- Search for Population Pulse in the Data Attributes section of the Heat Map panel.
- Select a time or type of day to visualize on the map and use the legend at the top of the panel to see the range of counts and the corresponding color. SiteZeus has 26 groupings you can use to analyze this data:
- Each of the 24 hours of the day
- Weekdays
- Weekends