What is a heat map?
A heat map displays data using colors instead of numbers. The heat map legend is dynamic and may change as you move around your project or zoom in and out. While the colors will always range from black to blue, the values assigned to each color will vary based on the area shown on the map.
How to generate a heat map:
SiteZeus allows you to create a heat map for attributes such as revenue, daytime population, customer ages, household income ranges, etc.
Revenue heat map
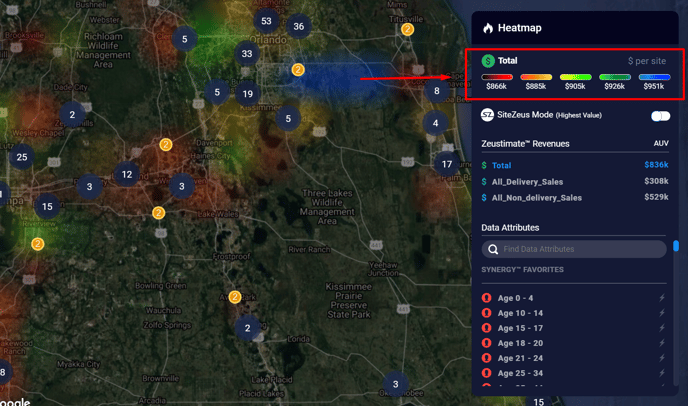
Revenue is the default value used to generate a heat map.
- From the map, click the heat map button (flame icon).

- The heat map window will open in the bottom-right corner of the screen. The legend will show you how the colors correspond to the revenue values.
Other attribute heat maps
To view a value other than revenue, select it using the options in the heat map window or the Data Attribute search bar.
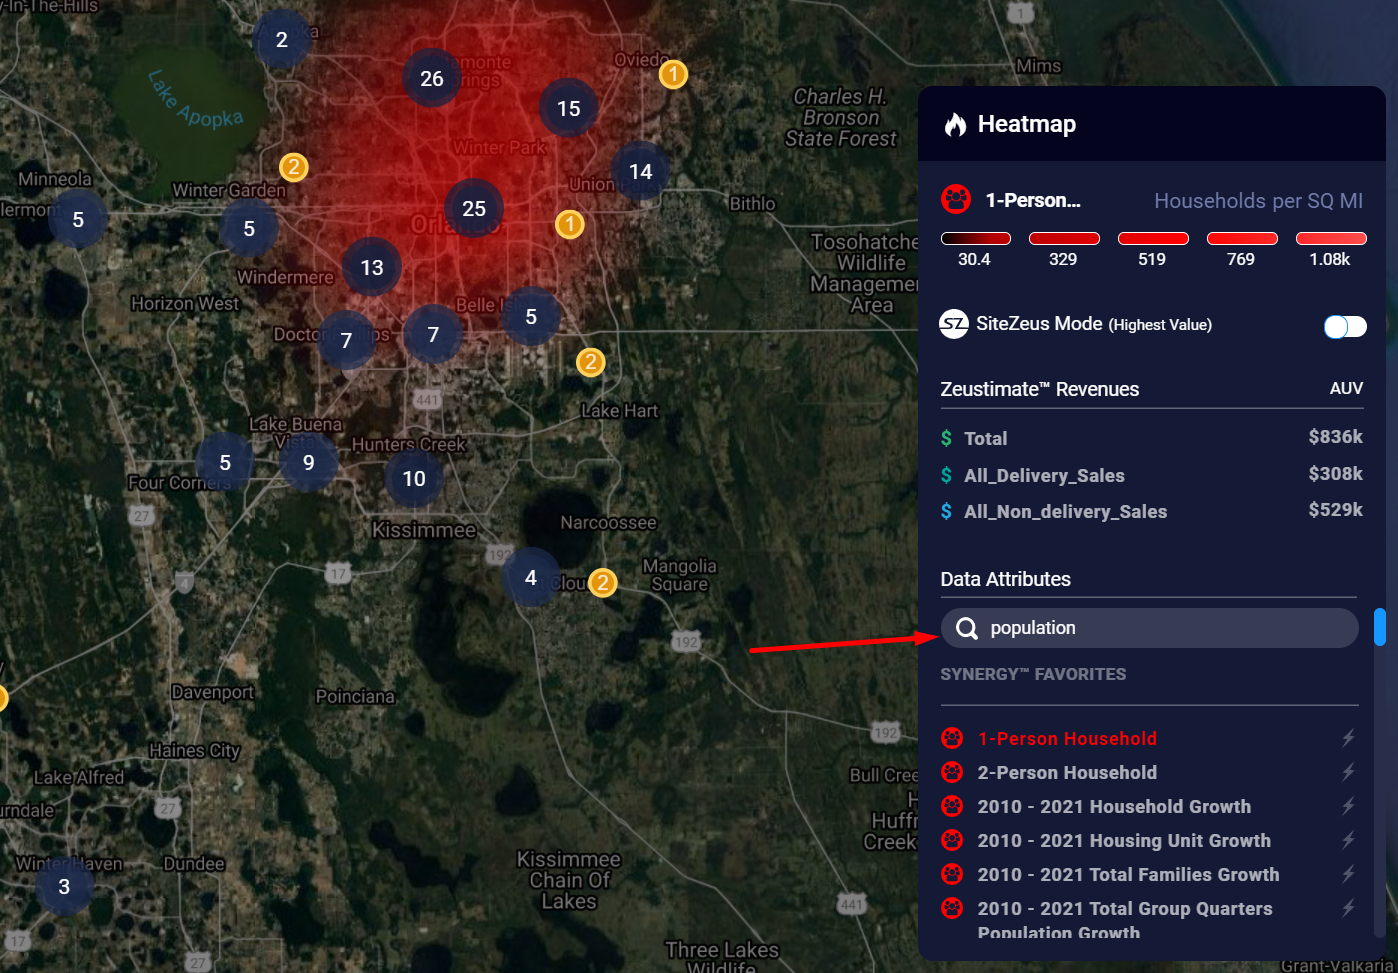
Note: Only one attribute may be depicted at a time.
Benefits of creating a heat map
A heat map offers a highly visual way to analyze data and can be helpful when looking at a large set of values, especially those correlated with geography. Think of it as the difference between looking at a spreadsheet of numbers and looking at the same numbers represented in a pie chart.
Map view
It may be easier to view a heat map with less map detail or with a darker background.
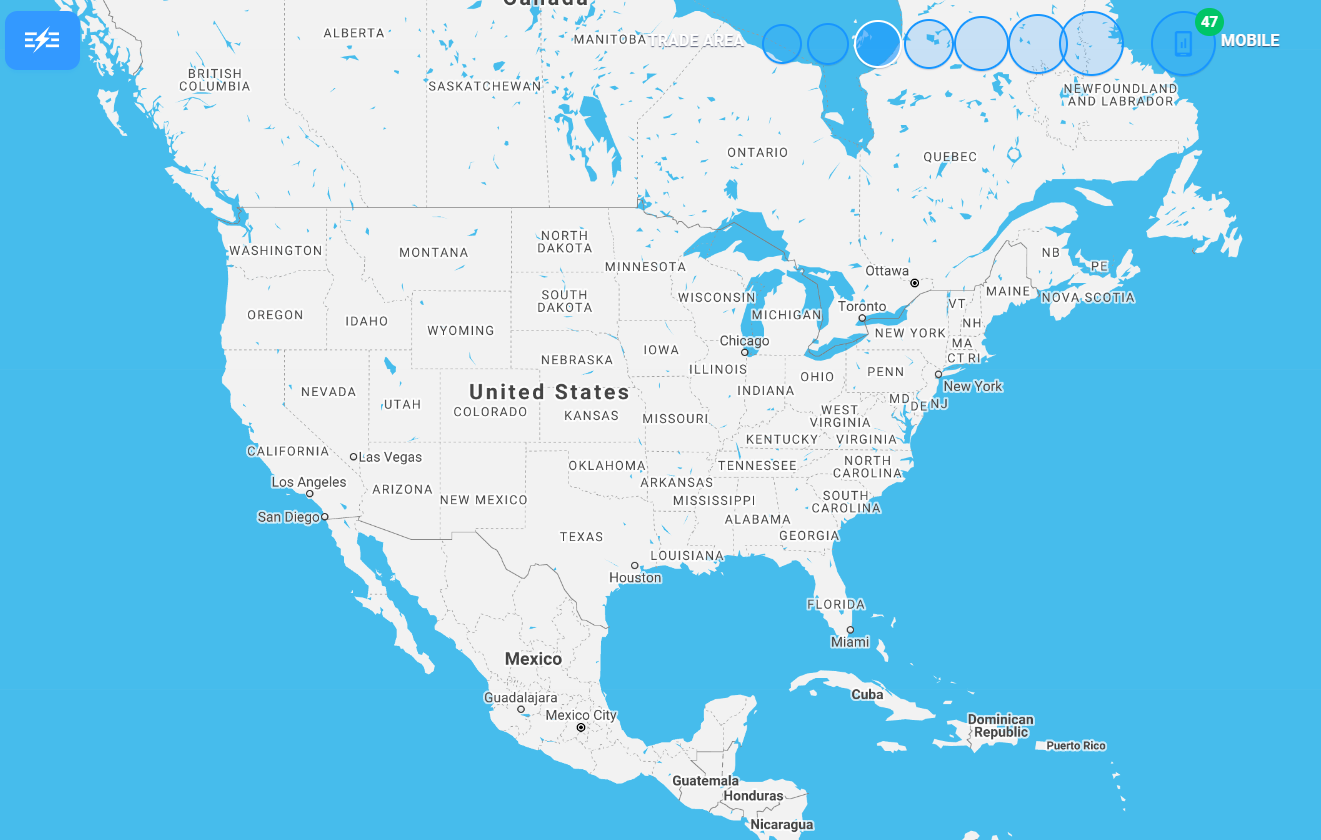
- To change the map view, click the map button.
- Clicking it once will change the background to Light Mode.
- Clicking it again will change the view to Dark Mode.
- Clicking it a third time will return the map to Satellite Mode.
 |
 |
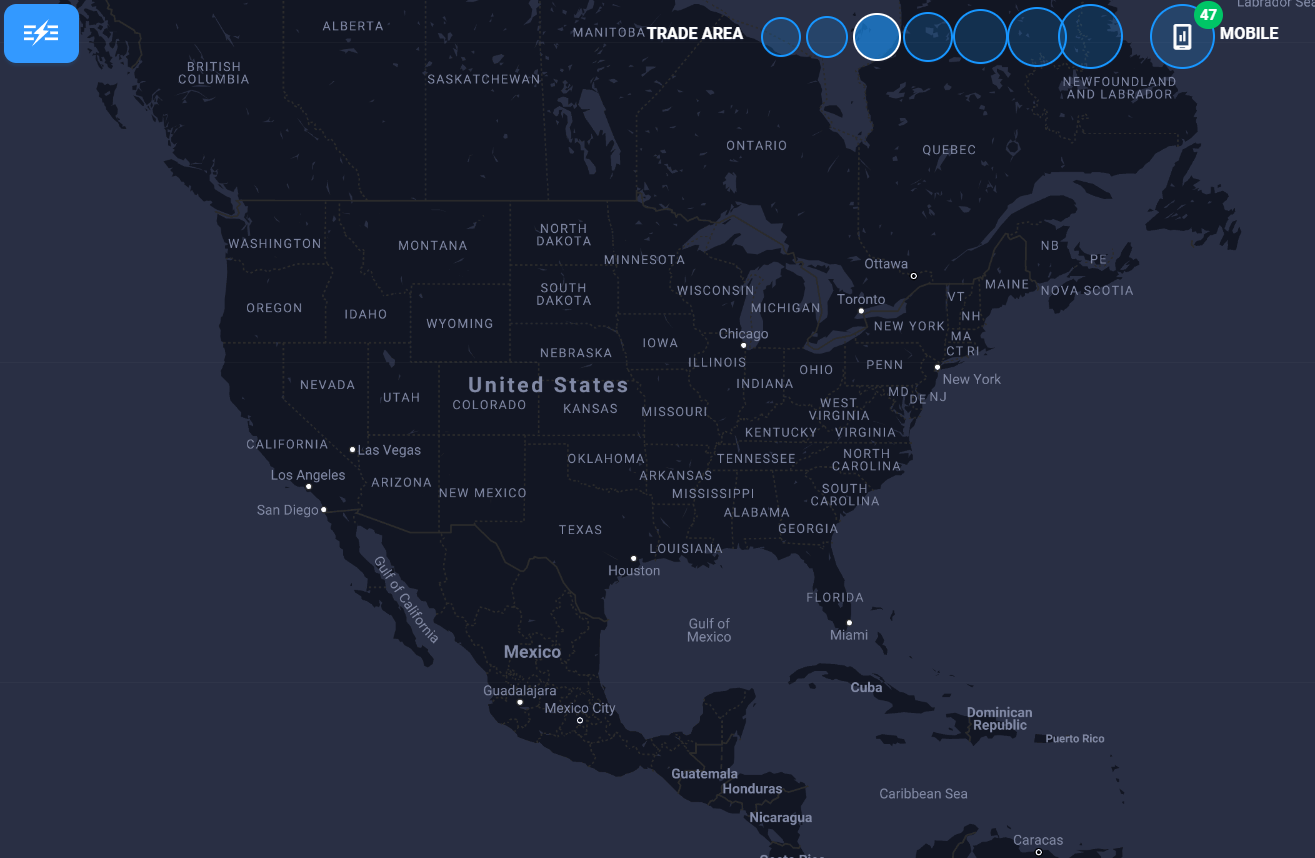 |
| Satellite Mode | Light Mode | Dark Mode |
Tip: Remember, the heat map will start regenerating if you zoom in or out of the map. Check the legend as you go and ensure wait for the heat map to load completely.