The confidence interval feature provides additional context for each forecast. It provides a range rather than a specific forecast, with a specified probability that the future site will land within the range. The default probability is a 70% confidence, but this can be modified. Used in conjunction with the Zeustimate, the interval provides:
- A measure of the relative uncertainty for a Zeustimate.
- A measure of the potential upside or downside of a site indicated by the Zeustimate’s position within the range.
- A Zeustimate on the lower end of the range signifies a larger upside than downside.
- A Zeustimate on the upper end of the range signifies a larger downside than upside.
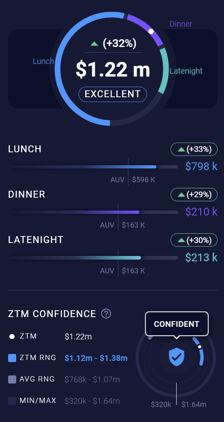
- An interval range that is smaller than the average range signifies a more confident prediction.
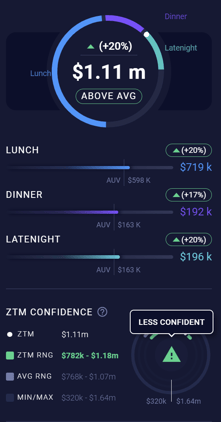
- An interval range that is larger than the average range means the site prediction is more uncertain and you should spend additional time evaluating it before moving forward.
Learn How To Turn On ZTM Confidence For Your Model:
- Go into the Variable Selector Synergy Power Panel.
- Turn on the Show Zeustimate Confidence toggle.
- Return to the main dashboard and begin to evaluate forecasts. You cannot view the ZTM Confidence in the Existing Site Test tab, however you can view it for Search Pins and Proposed Sites.
- Start to view that additional confidence level on Proposed Sites to better understand the model's level of confidence for the forecast generated.
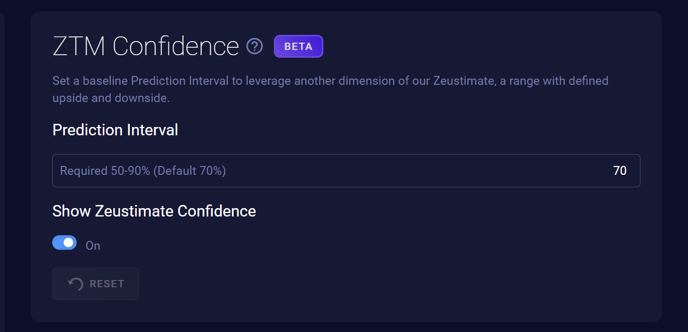
Note: Only adjust the prediction interval to something other than 70% after speaking about the option further with your team's analyst, since that movement will require a model rebuild and will impact your team's initial underlying model.
70% was identified as the default value that would provide the most optimal middle ground for a given prediction range.
Typically, the lower the percentage used, the larger the range in the final values for the lower and upper bound for a forecast.
Only Administrators, Co-administrators, and Model Analysts can use the Zeustimate Confidence controls and view these confidence metrics.
Learn About The Three Categories For Zeustimate Confidence
- Each forecast generated for a single site will have a category of confidence assigned to it when ZTM Confidence is turned on for a project.
- The icon color used in the ZTM Confidence section will correspond to the color of the forecast bucket. For example, an Excellent forecast will be Blue, while a Poor forecast will be Red.
| Confident | Less Confident | Not Confident |
|
These are projections that have a tight range of difference between their lower and upper bounds. These sites are tighter than the average range difference.
|
These are projections that have a wider range of difference between their lower and upper bounds. These sites are wider than the average range but do not breach the minimum or maximum of the model. |
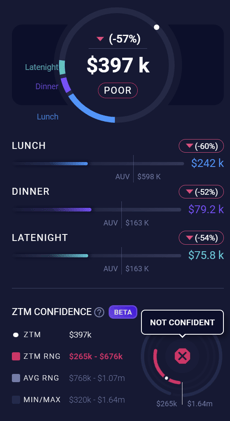
These are projections that have a large range of difference between their lower and upper bounds. These sites are wider than the average range and at lease one end of the projected range must lie outside of the minimum or maximum of the model. |