The Spatial.AI dataset helps you answer the question "Who is my customer?"
What is Spatial.AI?
SiteZeus has partnered with Spatial.AI to bring you social based consumer segmentation profiles by using billions of geotagged conversations happening on Twitter, Facebook, Instagram and other social platforms. Since the data reflects more about where customers go rather than where they live, the resulting dataset can capture the person’s sentiment while they’re out shopping, working, or even walking the dog. You’ll get a better feel for who your customer is, where they are, and what kinds of words, hashtags and conversations they’re having.
Quick Facts
- Index: Range of -10 to 10, 0=50% percentile, or national average.
- Age of the data: 2 year window of data at an update cadence of 2x/year.
- Census area size: Block group level
- Data source: 30 million users social media users gathered through paid partnerships with social media companies and open APIs.
Turning it on
Spatial.AI turns on automatically once you purchase it via Manage Account --> Subscriptions. For more on account management, visit the knowledge base page How do I manage my Account?
Where can I see it?
Spatial.AI data behaves like other variable in SiteZeus and can be reported upon, heat mapped, and displayed in the Synergy Grid. With a Synergy tier subscription, it will even be incorporated into your model .
Heatmap
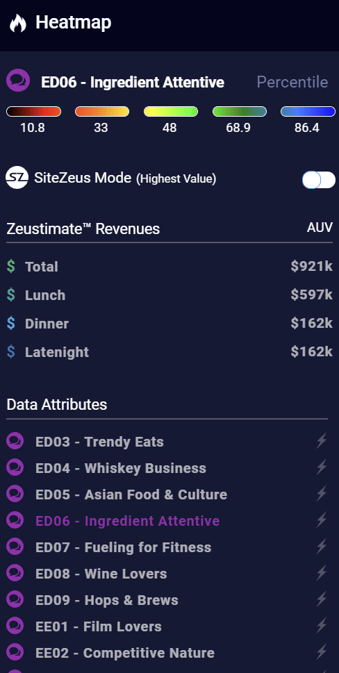
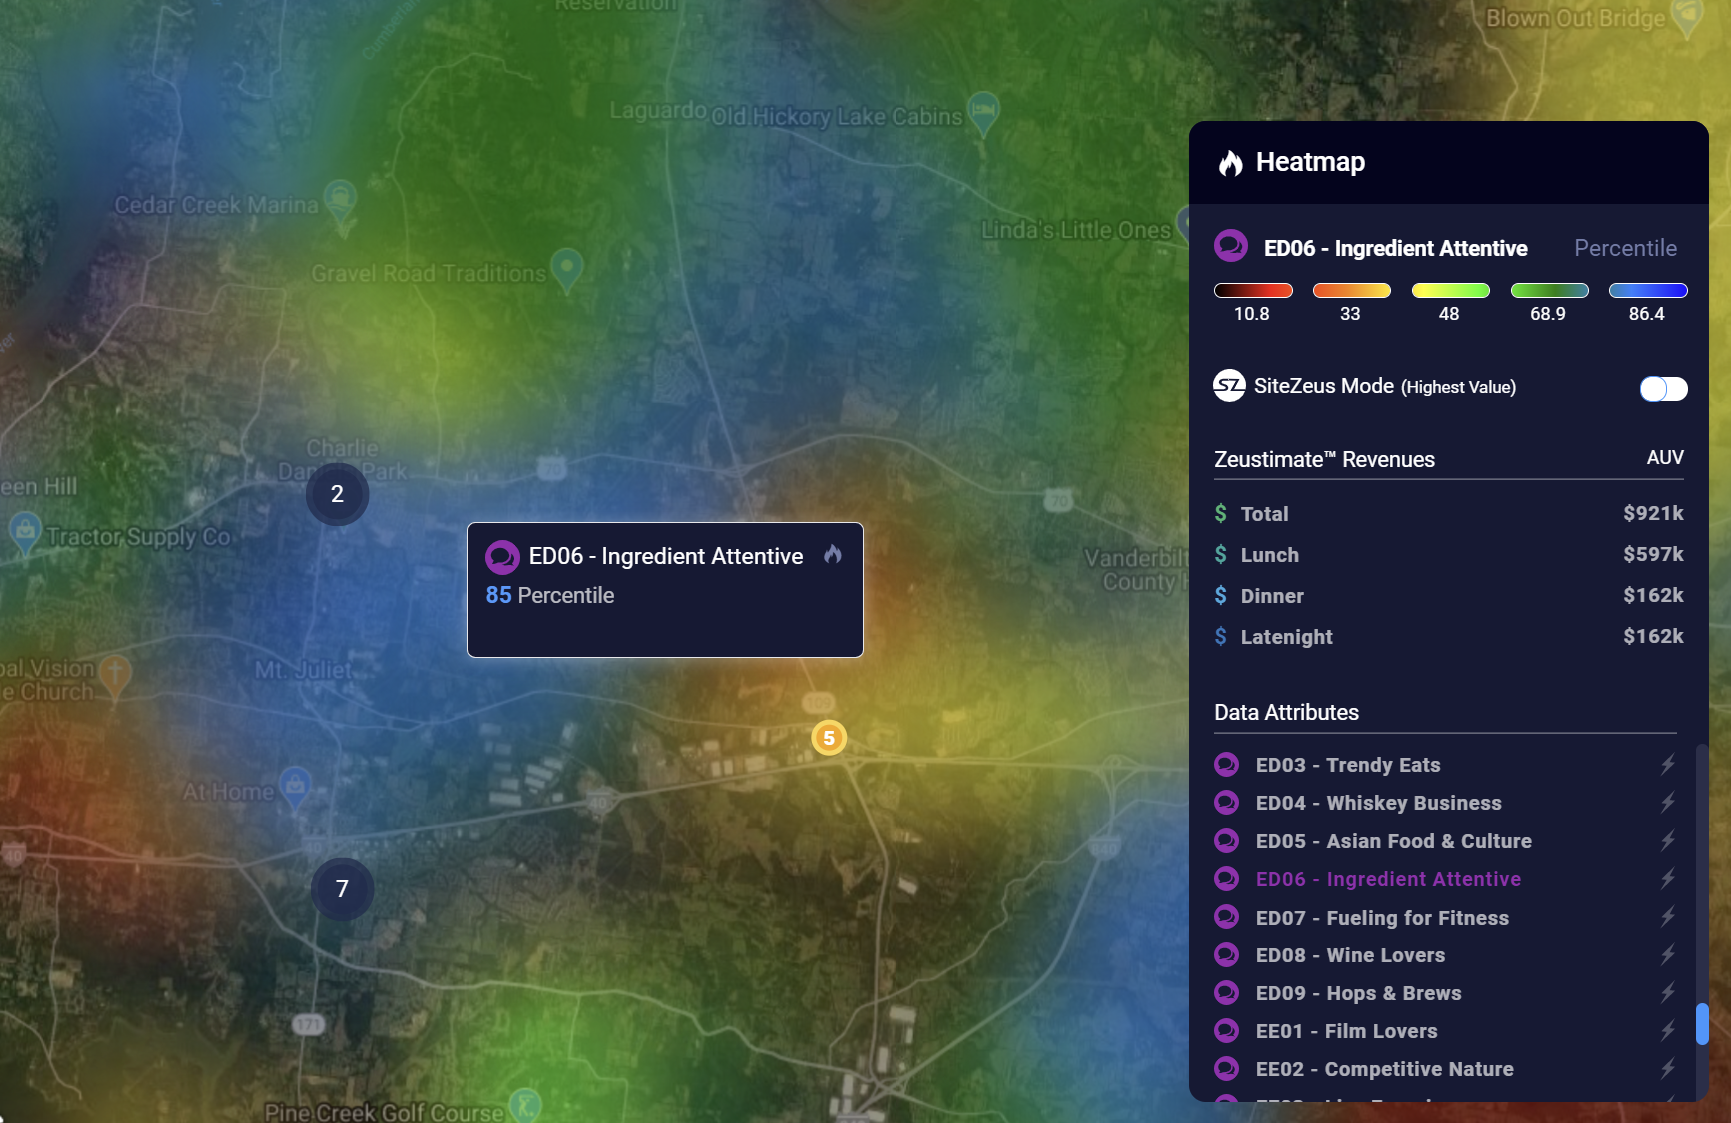
To render a Spatial.AI segment into a heat map, simply scroll down further in the Heatmap Toolbox and select one or you can always search by name. For more on the Heatmap, visit the Heatmap knowledge base page.
Spatial.AI data will display using a range of colors since it will show an index of -10 to 10, with zero as the national average.
The data is relative to the nation, much like the way Black Box data displays.
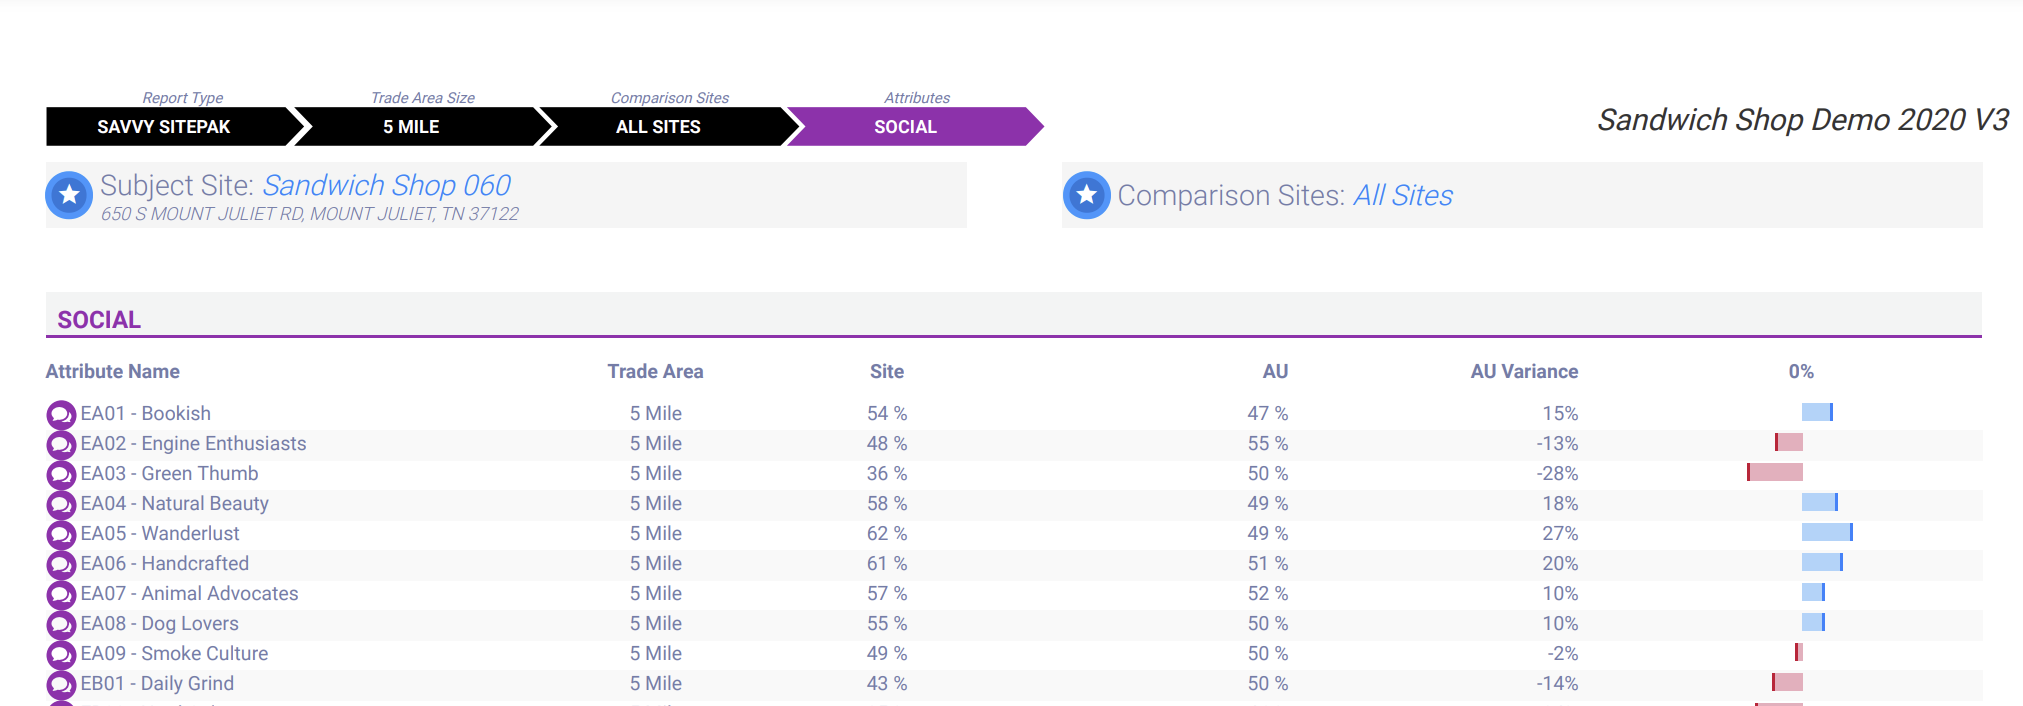
Reports
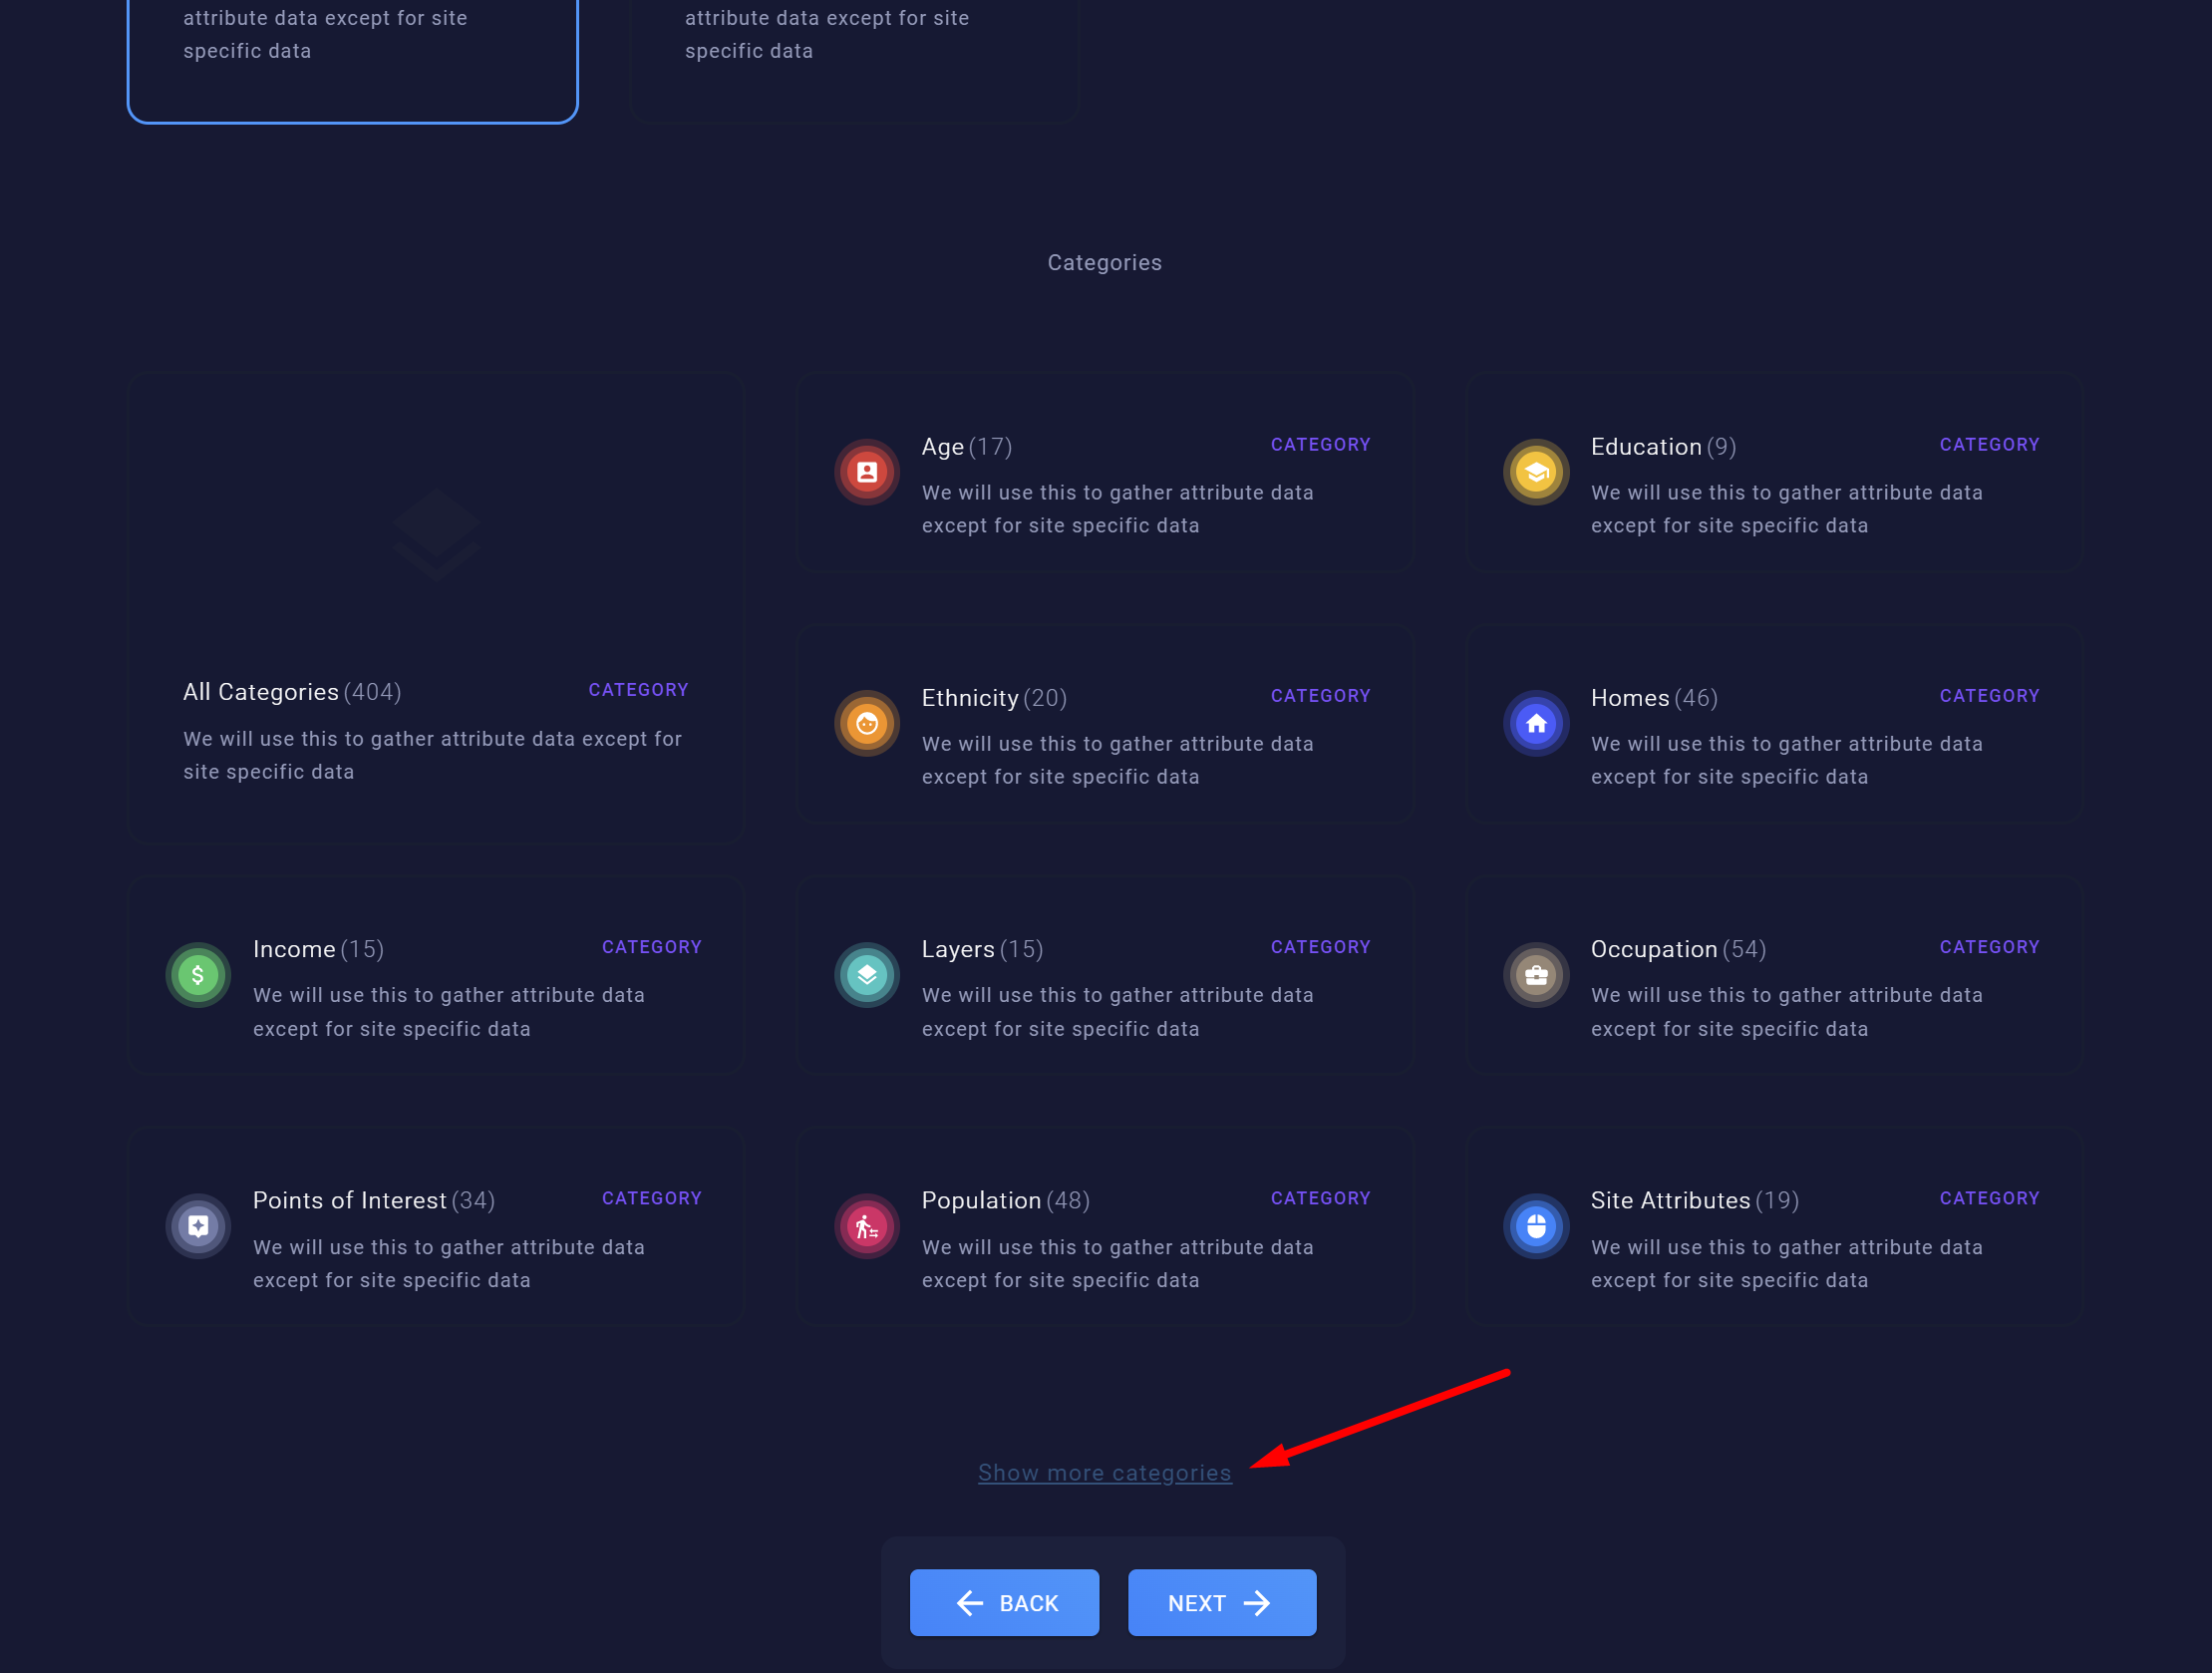
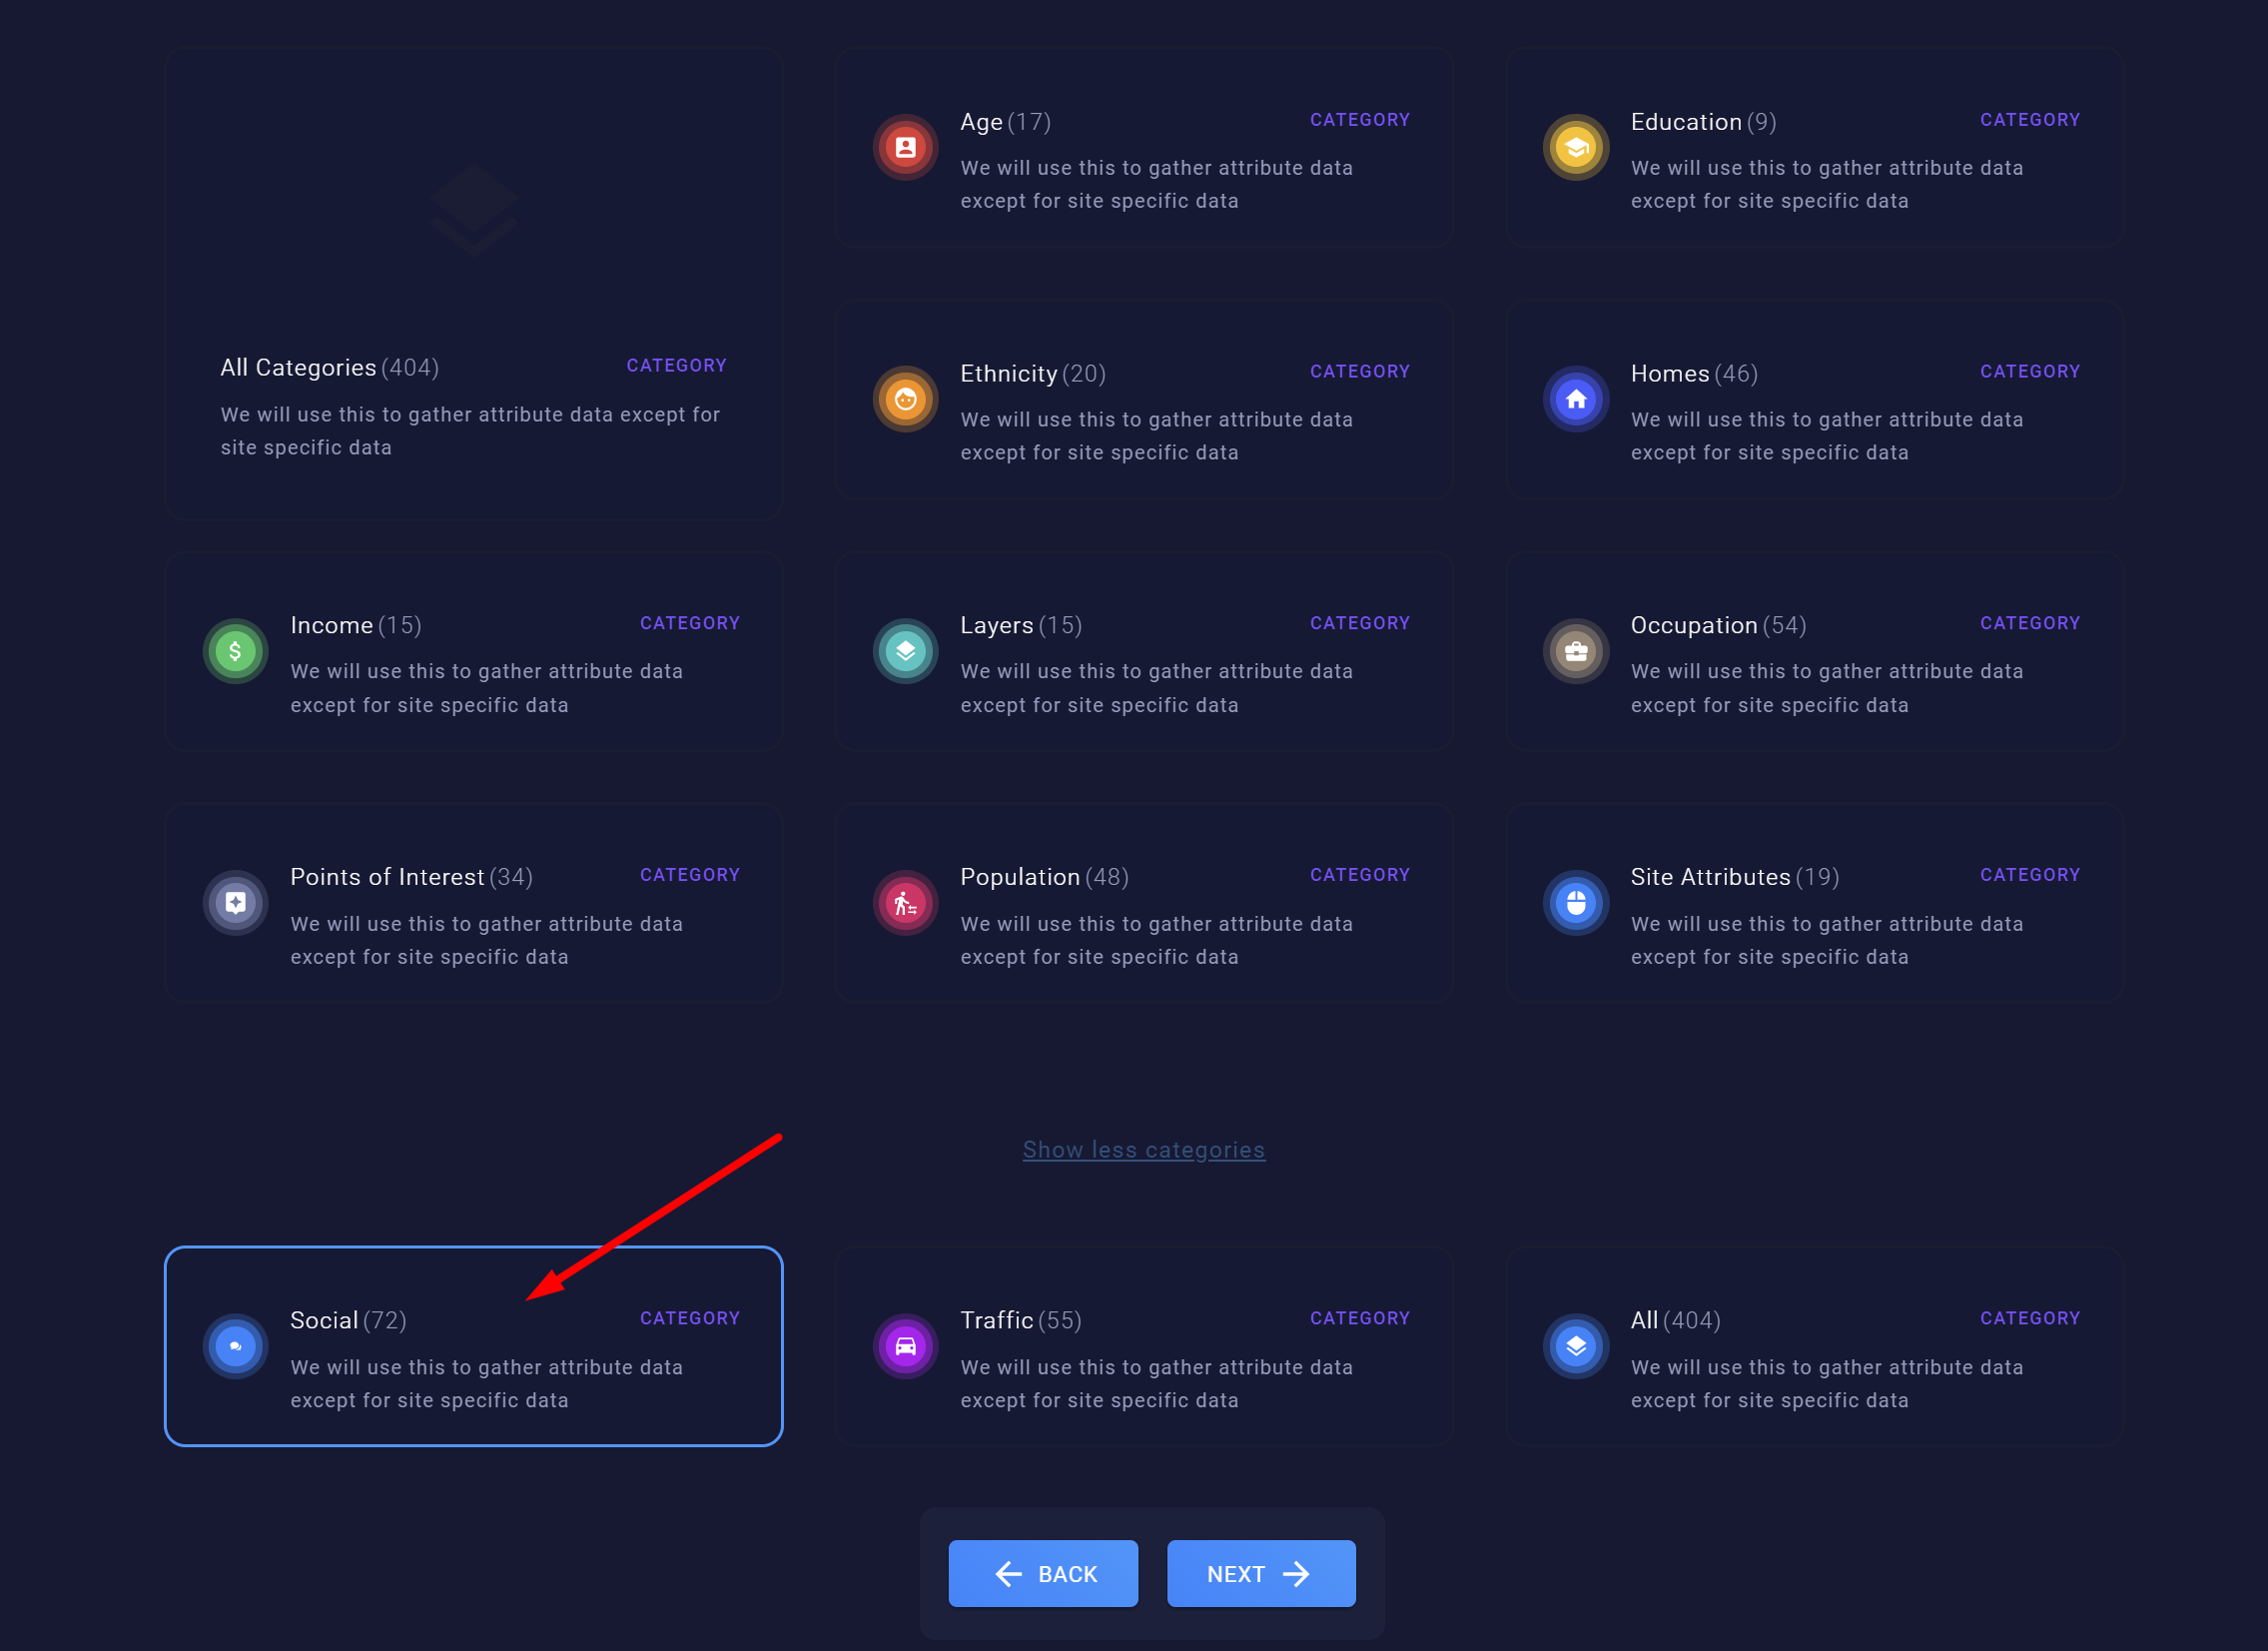
To view the Spatial.AI variables, you simply proceed through the Report Wizard as usual, except if you want to see only the Spatial.AI segments in your Simply, Simply Compare, Savvy, or Synergy SitePak. For this option shown below, scroll to the bottom of the Attribute choice page of the Report Wizard, "Show More Categories" to expose the Social categories.
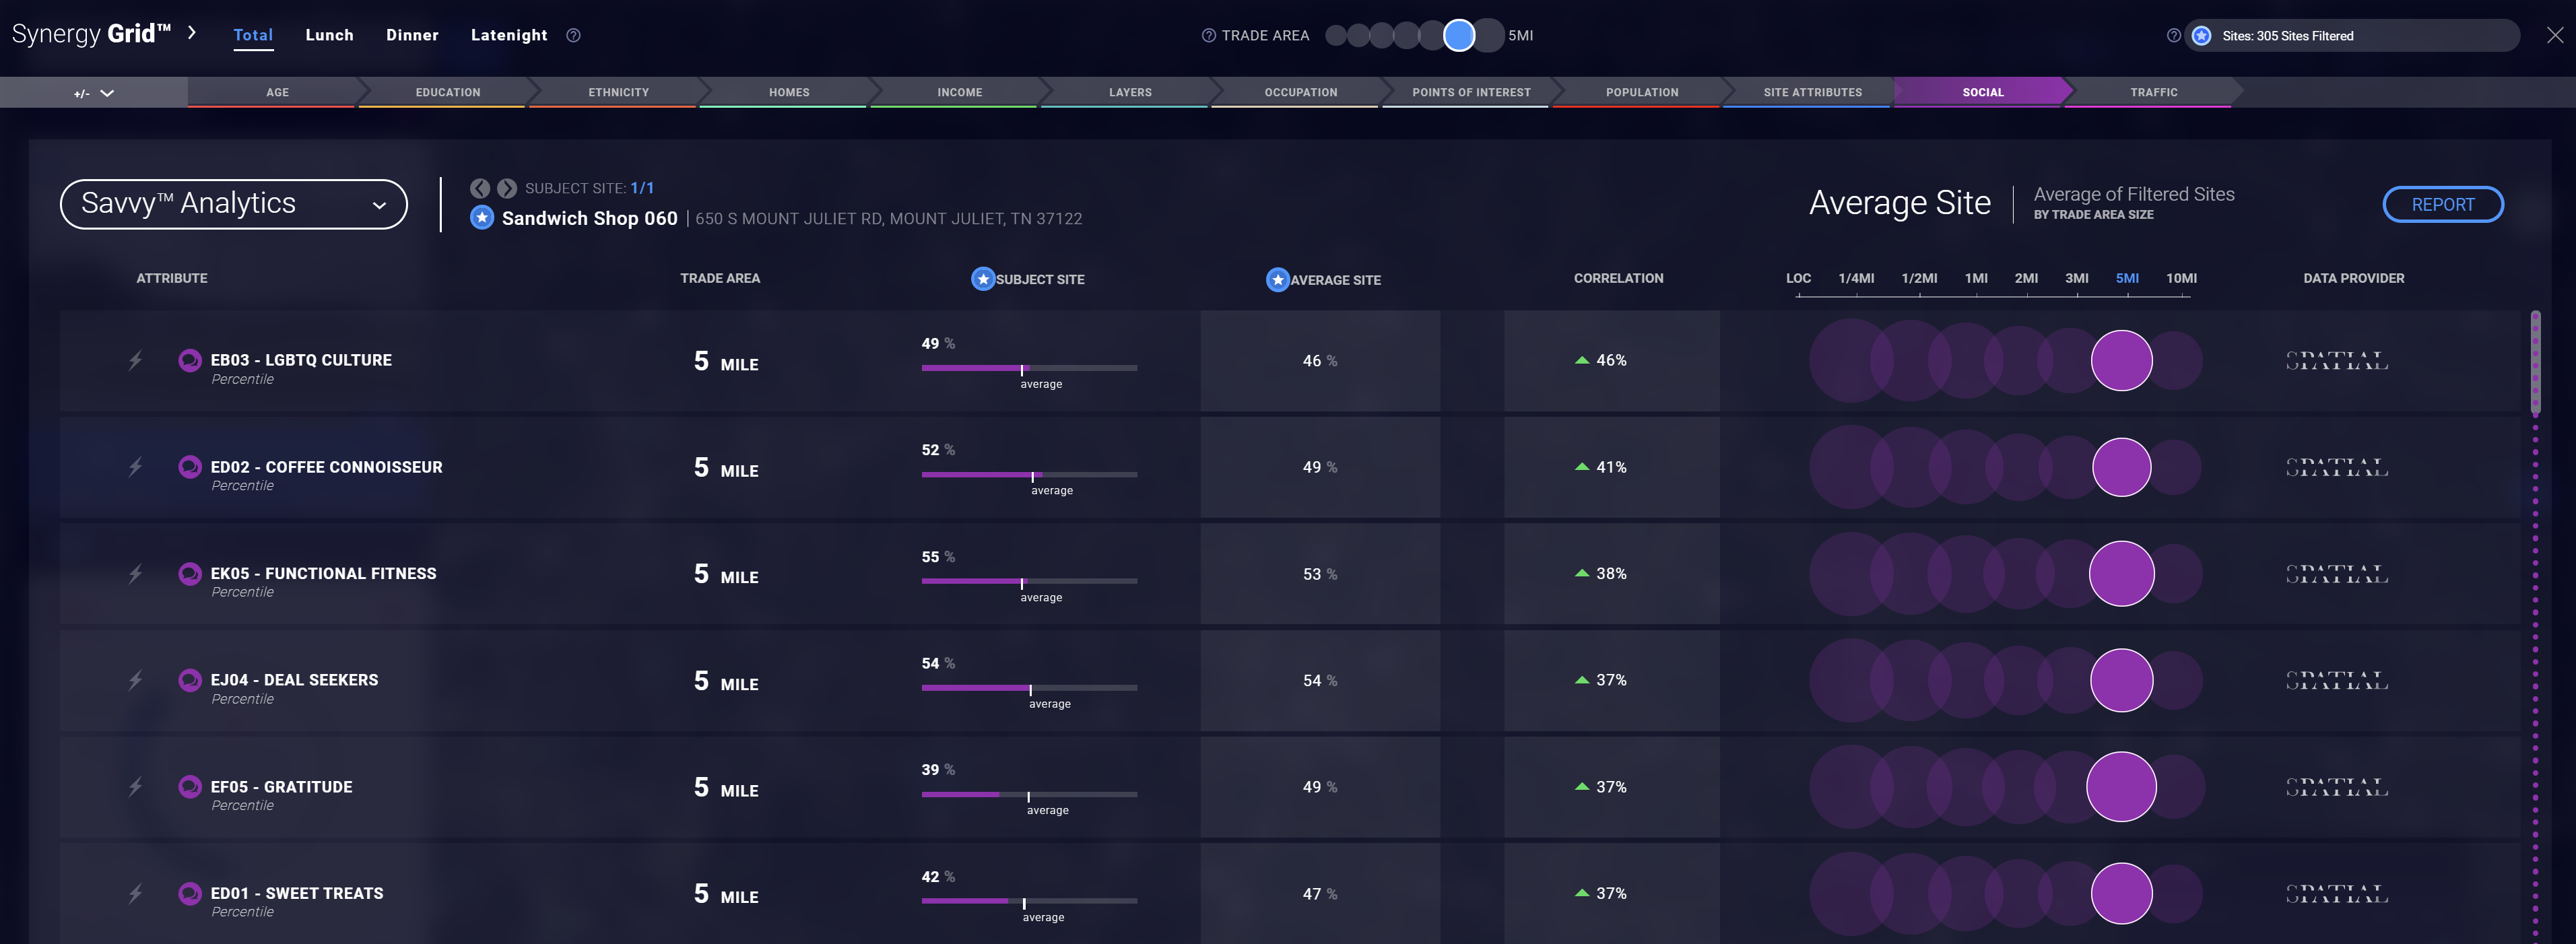
Synergy Grid

Like other variables, Spatial.AI data is viewable in the Synergy Grid. The segments are in the category of Social.
The Synergy Grid is a great place to find the definitions of each segment. By hovering over the info icon, the definition box will display.
In the image below, you can see what some of the top social variables are for the subject site.
For more on the Synergy Grid, take a look at the knowledge base video Synergy Grid Overview.
Model Impact (Synergy Subscription Tier Only)
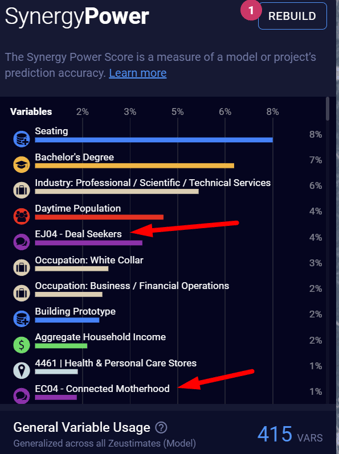
Once purchased, Spatial.AI data will then be incorporated into and impact your model like the demographics from Claritas, traffic counts from Inrix, and the store attributes you provided us when we initially built your project.
Why does this matter? The more data available, the better the chance your model accuracy may improve, resulting in improved revenue forecasts.

As with your other variables, you’ll see this information in the General Variable Usage for your project, as well as ZTM Variable Impact for the selected site. Don't remember the difference between the two? Click to check out a video explaining them in more detail.